- Research
- Open access
- Published:
Evaluation of influence of spectral and prosodic features on GMM classification of Czech and Slovak emotional speech
EURASIP Journal on Audio, Speech, and Music Processing volume 2013, Article number: 8 (2013)
Abstract
This article analyzes and compares influence of different types of spectral and prosodic features for Czech and Slovak emotional speech classification based on Gaussian mixture models (GMM). Influence of initial setting of parameters (number of mixture components and used number of iterations) for GMM training process was analyzed, too. Subsequently, analysis was performed to find how correctness of emotion classification depends on the number and the order of the parameters in the input feature vector and on the computation complexity. Another test was carried out to verify the functionality of the proposed two-level architecture comprising the gender recognizer and of the emotional speech classifier. Next tests were realized to find dependence of some negative aspect (processing of the input speech signal with too short time duration, the gender of a speaker incorrectly determined, etc.) on the stability of the results generated during the GMM classification process. Evaluations and tests were realized with the speech material in the form of sentences of male and female speakers expressing four emotional states (joy, sadness, anger, and a neutral state) in Czech and Slovak languages. In addition, a comparative experiment using the speech data corpus in other language (German) was performed. The mean classification error rate of the whole classifier structure achieves about 21% for all four emotions and both genders, and the best obtained error rate was 3.5% for the sadness style of the female gender. These values are acceptable in this first stage of development of the GMM classifier. On the other hand, the test showed the principal importance of correct classification of the speaker gender in the first level, which has heavy influence on the resulting recognition score of the emotion classification. This GMM classifier should be used for evaluation of the synthetic speech quality after applied voice conversion and emotional speech style transformation.
1. Introduction
Speaker identification and emotional speech recognition systems, as well as speech recognition systems, use different types of speech features which can systematically be divided into segmental and supra-segmental ones[1]. These include traditional features such as linear predictive coefficients, linear prediction cepstral coefficients, mel-frequency cepstral coefficients (MFCC)[2], or unconventional ones like perceptual linear predictive coefficients, log frequency power coefficients[3], gammatone frequency cepstral coefficients[4], or compact multiclass support vector machines[5]. Several spectral features [spectral centroid (SC), spectral flatness measure (SFM)[6, 7], spectral entropy (SE)[8, 9], etc.] are used to complement the mentioned basic segmental features for speaker recognition[10]. Supra-segmental features comprise statistical values of parameters describing prosody by duration, fundamental frequency, and energy. Included in this category is also a separate group of features constituting the voice quality parameters: jitter, shimmer[11], Hammarberg index[12], Liljencrants-Fant features[13], and spectral tilt[14]. All mentioned speech identification systems and classifiers are usually based on statistical approach, using the discriminative or artificial neural networks[15, 16], hidden Markov models (HMM)[17], or Gaussian mixture models (GMM)[18, 19]. Spectral features like MFCC together with energy and prosodic parameters are most commonly used in GMM emotional speech classification[20]. On the other hand, in automatic speech recognition systems based on HMM approach, the acoustic vector comprises such components as the formant central frequencies and bandwidths. Relative position of formants and formant trajectories can be used as the main indicator for speech classification in the voiced parts[21].
We are mainly focused on voice conversion and emotional speech style transformation in the text-to-speech systems speaking in Czech and Slovak[22] for the voice communication systems with the human–machine (computer) interface[23], or in the communication aids for handicapped people[24, 25]. These two languages (belonging to the Slavonic languages) are similar but different, therefore we can use a common speech corpus to obtain spectral parameters, but on the phonetic and prosody level the synthetic speech must be processed separately. In our previous work, we performed statistical analysis and comparison of emotional speech properties for the Czech and Slovak languages using basic spectral features consisting of the first three formant positions together with their bandwidths and formant tilts, complementary spectral features (CSF) (SC, SFM, and SE), and prosodic parameters—fundamental frequency (F0), microintonation, jitter, shimmer[26].
The aim of this study is to develop a simple emotional speech style classifier based on GMM approach usable for objective evaluation of the finally produced synthetic speech quality as an option to manually performed listening tests. This statistical evaluation approach can be combined with the classical one in the form of listening tests or it can replace them. The main advantage of this system is that it works automatically without human interaction which is a great problem in collective realization of listening tests (more people together—for keeping the same test conditions), and the obtained results can numerically be matched—as the objective comparison criterion. The article describes performed experiments and comparison of GMM classification of male and female acted speech in four emotional states (joy, sadness, anger, and a neutral state) spoken in Czech and Slovak. This speech corpus was primarily used for determination of spectral and prosodic parameters for emotional speech conversion[26]. This article is also aimed to verify a functionality of the proposed GMM emotional speech classifier structure including the stability of the obtained results, to perform an analysis of influence of setting of parameters for GMM training process (number of used mixture components and used number of iterations), and above all, to investigate the influence of different types of used speech features (spectral and/or supra-segmental). In addition, we try to confirm our working hypothesis that speech data corpora in the other languages (primarily intended for emotional speech recognition) can successfully be used for basic testing of the designed GMM emotional speech classifier. On the other hand, the order of parameters in the input feature vector has minimal influence on the classification error rate of the whole emotional speech classifier.
2. Subject and method
2.1. Short description of the developed emotional speech classifier and its expected properties
The basic draft functional structure of our currently developed GMM emotional speech classifier consists of the two-level architecture as it can be seen in Figure1. In the first step, the gender type (male/female) is recognized, and consequently the emotional speech style is identified for each of two gender classes. In both levels of the identification process, different types of the feature vectors together with the trained GMM models (with different number of used mixtures) are used due to different requirements and different statistical properties necessary for gender type classification and emotional style recognition. Because we would like to recognize four emotional speech styles and two basic types of gender, we need to obtain four trained emotion models for classification of speech pronounced by male speakers and four models for classification of sentences spoken by female speakers, and two summary models for gender recognition (trained on the data of sentences pronounced in all classified emotional styles). By the reason of not knowing exactly how and which speech parameters characterize several emotions of speech in Czech and Slovak, we formulate six basic sets of speech parameters for the GMM classifier. Another issue is to find the optimum number of parameters in the feature vector for robust GMM classification of emotions. As the first trial, the length of the input feature vector was experimentally set to 16, as a result of compromise between lower limit of functionality and computational complexity requirements.

Block diagram of the currently developed GMM emotional speech style classifier for Czech and Slovak.
The two-level classifier is based on the statistical approach—therefore outputs from the gender recognition or emotion classification block are the probability values subsequently evaluated in the block called the score discriminator (see Figure1). Consequently, different values of the score can be obtained when the same sentence is processed. These different score values can bring about an error in evaluation of the gender type or the emotion class. This situation can arise from several various reasons including
-
processing of the input speech signal with a short time duration, from which only a small number of feature vectors is obtained during the analysis,
-
classification using too short input feature vector (small number of parameters in the vector),
-
application of an incorrect type of a gender model for determination of an emotional class (e.g., using the male model for classification of emotion sentences uttered by a female speaker).
Hence, the stability tests to verifying the proper function parts of the recognizer as well as the whole classifier are necessary to be performed. These tests are also important for mapping of the mentioned negative reasons of the resulting system error. In addition, we assume that the choice of feature types (spectral properties and prosodic parameters) and the method of their determination from the input speech signal would significantly determine the proper function of the GMM classifier. The correctness and quality of obtained results also depends on the correctness and accuracy of the initialization and training phase during the creation of a given GMM model. Above all, it means the properly determined number of used mixtures and the number of passed iterations. It means that it is also necessary to judge influence of these parameters on gender recognition and emotion classification error rate. Before the first practical use of the whole classifier, individual function blocks as well as their cascade connection must be tested. Subsequently, suitability of the whole classifier for our purpose—objective tool for evaluation of the synthetic speech quality after applied emotional style conversion in Czech and Slovak—will be determined.
2.2. Basic principles of applied classification method
The GMM can be defined as a linear combination of multiple Gaussian probability density functions (GPDF) of the input data vector x
where P k (x) is the GPDF (expressed with the help of d as the dimension of the GPDF, Σ is the covariance matrix, and μ is the vector of mean values), K is the number of these distribution functions, and α k are the weighting parameters. For GMM creation it is necessary to determine the covariance matrix Σ, the vector of mean values μ, and the weighting parameters α k from the input training data. Using the expectation-maximization (EM) iteration algorithm the maximum likelihood function of GMM is defined as follows:
where P k ( ) are the GPDFs, K is the number of these functions in a mixture, M is the number of trained vectors, α k are the weighting parameters, and the term Θ = (μ, Σ) represents parameters of the Gaussian probability distribution. For control of the EM algorithm, the Niter parameter corresponding to the number of iteration steps is used, and the Ngmix represents the used number of mixtures in each of the GMM models. The iteration stops when the difference between the previous and the current probabilities fulfills the internal condition or the predetermined maximum number of iterations is reached. To initialize the GMM model parameters, the K-means algorithm is usually used—this procedure is repeated several times until the minimum deviation of the input data sorted in N clusters S = {S1,S2,…,S N } is found.
The GMM classifier returns probabilities (the so-called scores) that the tested utterance belongs to the GMM model while the identification of emotion (or gender) i* is given by the maximum overall probability for the given emotion (gender)
where the emotion/gender score(T, i) is the returned probability value of the GMM classifier for the models trained for each emotion/gender category and the tested sentence T (an input vector of features obtained from this sentence).
2.3. Determination of basic and complementary spectral properties of emotional speech
The basic speech spectral properties consist of the formant positions F1, F2, F3, and their bandwidths as well as the auxiliary parameters (the formant tilts) that can be calculated by several techniques. We apply the approach combining two basic methods for formant position determination (see Figure2).
-
1.
Indirect—formant positions are determined as the first three local maxima of the smoothed spectral envelope where its gradient changes from positive to negative. Corresponding bandwidths are obtained as frequency intervals between the points of 3 dB decrease of the magnitude spectrum relative to the formant amplitudes. The smooth spectral envelope of the speech signal can be determined during cepstral analysis [27]. Cepstral analysis of the speech signal is performed in the following way: first, the complex spectrum using fast Fourier transform (FFT) algorithm is calculated from the input samples (after segmentation and weighting by a Hamming window). In the next step, the power spectrum is computed and the natural logarithm is applied. Application of the inverse FFT algorithm gives the symmetric real cepstrum. Limitation to the first N 0 + 1 cepstral coefficients represents an approximation of the log spectrum envelope
(4)where the first cepstral coefficient c0 corresponds to the signal energy.
-
2.
Immediate—estimation of the formant frequencies and their bandwidths directly from the complex roots of the linear predictive coding (LPC) polynomial A(z)—poles of the LPC transfer function. The formant frequency F k and the 3 dB bandwidth B k in (Hz) can be determined as follows:
(5)where fs is the sampling frequency and θ k is the angle in (rad) of the complex root.
Figure 2 
Block diagram of determination of the basic and auxiliary formant features from the spectral envelope.

Resulting values obtained with the help of the direct method are corrected by the results of indirect determination of the spectral envelope (smoothed by cepstral limitation) according to the following two criteria:
-
the values of 3-dB bandwidths must be less than 500 Hz[28],
-
the found values of the first three formant positions must fall within the corresponding frequency interval depending on the gender type (male/female)[29].
The auxiliary spectral parameters like the formant tilts are defined as directions and angles between the first three spectral maxima of a smoothed envelope. The general bisector formula in the parametric form can be used for calculation
where k is a bisector direction, y1,2 represent values of power spectral density (PSD) in (dB) of determined formants, and x1,2 are positions of the formants on the frequency axis in (Hz). For k < 0, the formants have declining trend, for k > 0 the formants have ascending trend. The resulting angle φ in degrees is defined as φ = (Arctg (k)/π)⋅180.
The cepstral coefficients {c n } obtained during the cepstral analysis process bring information about spectral properties of the human vocal tract[27]. As the shape of the vocal tract depends also on the emotional state of the speaker, these coefficients can be used in the feature vector for GMM emotional classification. The mentioned cepstral analysis (see Figure3) can also be used for determination of additional speech parameters—the CSF including
-
1.
The SC defined as a center of gravity of the power spectrum [10] which can be calculated using the absolute value of the FFT |S(k)| of the speech signal x(n). The SC values in (Hz) are determined as
(7)where fs is the sampling frequency, and NFFT represents the number of the processed points for FFT calculation.
-
2.
The SFM can be used to determine the degree of periodicity in the signal [6, 7]. This spectral feature is calculated as a ratio of the geometric and the arithmetic mean values of the power spectrum by the following formula
(8) -
3.
The SE is a measure of spectral distribution [10]. It quantifies a degree of randomness of spectral probability density represented by normalized frequency components of the spectrum. SE will be low for spectra having clear formants whereas for unvoiced sounds it will be higher. Shannon SE is defined as follows:
(9)where P(k) represents the PSD values.
-
4.
The harmonics-to-noise ratio (HNR) provides an indication of the overall periodicity of the speech signal. Specifically, it quantifies the ratio between the periodic and aperiodic components in the signal [30]. The HNR is a function of glottal noise and other factors such as jitter and shimmer which are responsible for the aperiodic component in the voice. Noise at harmonic locations is typically estimated as the average of the noise estimates at either side of the harmonic locations. The spectral-based HNR expressed in (dB) is computed as follows:
(10)where |S(k)| represents harmonic amplitudes, |N(k)| is the noise estimate, and NFFT is the number of points up to the sampling frequency. The summation index NFB depends on the chosen frequency band, where fs is the sampling frequency and fmaxFB is the maximum frequency of the band (NFB equals NFFT/2 for the whole band up to fs/2). The spectrum portion of harmonic amplitudes is summed from low frequencies corresponding to the index NFBLO (approx. 50–70 Hz), the noise portion is calculated from high frequencies corresponding to the index NFBHI (approx. 1500–2000 Hz—depending on the gender type).
Figure 3 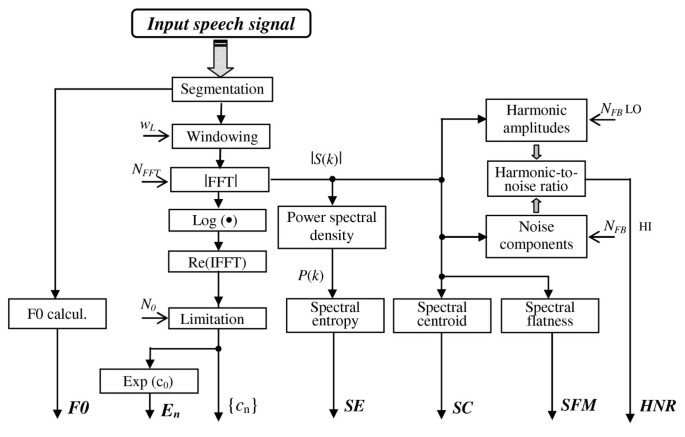
Block diagram of calculation of the basic and CSF of emotional speech.

In our algorithm, the values of the HNR, SC and SFM are obtained only from the voiced speech frames. In the case of the SE parameter, the values are determined from the voiced as well as unvoiced frames with the signal energy higher than the threshold (calculated as ec 0 using the first cepstral coefficient) for elimination of speech pauses between words within the sentence and beginning and ending parts of the sentence[26].
2.3. Estimation of supra-segmental features of emotional speech
Microintonation, together with sentence melody and word melody, represents melody of speech given by F0 contour. Microintonation component of speech melody can be supposed to be a random, band-pass signal described by its spectrum and statistical parameters. The voice quality parameter “jitter” describes pitch perturbations in the context of vocal expression. Our approach to microintonation estimation is somewhat similar to that of[31] where a jitter related to microvariations of a pitch curve is computed as a relative number of zero crossings of a derivative pitch curve normalized by utterance duration. Speech frames classified as voiced are analyzed separately depending on the emotional state and the gender type. The whole supra-segmental feature analysis process is divided into seven phases corresponding to the block diagram in Figure4:
-
1.
Determination of F0 values, definition of the voiced and unvoiced parts of the processed speech signal.
-
2.
Determination of F0Mean values and calculation of the linear trend (LT) by the least mean square method.
-
3.
Calculation of differential microintonation signal F0DIFF by subtraction of these values from the corresponding F0 contours (F0Mean and LT removal)
(11) -
4.
Detection of zero crossings, calculation of zero crossing periods L Z, and relative values defined as L Z rel = N Z /N V , where N Z is the total number of zero crossings in each of the four emotions, and N V is the total number of voiced frames.
-
5.
Calculation of the frequency parameters from the zero crossing periods
(12)where fF is the frame frequency.
-
6.
Calculation of the absolute jitter J Abs values as the average absolute difference between consecutive pitch periods L measured in samples [30]
(13)where fs is the sampling frequency and N L is the number of extracted pitch periods.
-
7.
Calculation of the shimmer measure as a period-to-period variability of amplitudes of a speech signal [30]
(14)where An is the peak amplitude value of the n th frame of the input speech signal, and NV is the number of voiced frames.
Figure 4 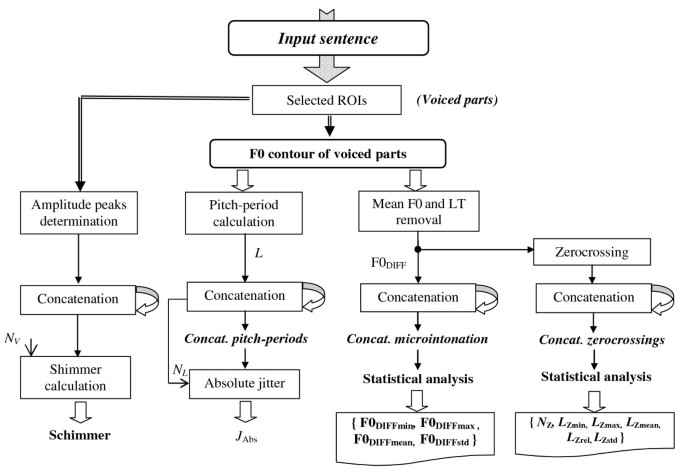
Block diagram of estimation of the supra-segmental features.

3. Description of performed analysis and comparison experiments
Our experiments were aimed at comparison and analysis of
-
1.
influence of the used number of mixtures and the used number of training iterations on GMM emotion classification;
-
2.
influence of the used number of mixtures and the used number of training iterations on the GMM gender recognition error rate;
-
3.
influence of different length of the feature vector on GMM emotion classification error rate;
-
4.
influence of different length of the feature vector on the computational time (complexity) of the phases: GMM creation, training, and classification (recognition);
-
5.
influence of the type of the features in the feature vector on GMM emotion classification and gender recognition error rate;
-
6.
test of the complete GMM emotion classifier with the best training parameters (N iter and N gmix) and the feature set with the best score (minimum mean error rate).
To find the optimum number of mixtures for GMM classification and the optimum number of training iterations the influence of using one to eight mixtures was investigated for classification of four emotional speech styles and the influence of one to four mixtures was tested for recognition between male and female genders. The influence of the used number of iterations on the GMM classification/recognition error rate was analyzed in eight cases with the values in the range of <100–1500>. For the analysis of different number of values in the feature vector (see points 3 and 4), three types of vectors were used with different lengths of NFEAT = 8, 16, and 32 values. In the case of the shortest one with the length of 8 we used parameters {1, 5, 6, 8, 10, 12, 13, 16} of the original feature vector with the length NFEAT = 16.
In addition, we perform a set of tests of stability consisting of
-
1.
stability of the GMM emotion classification process when the time duration of the input processed sentence shortens;
-
2.
stability of the GMM emotion classification process with the limited length of the feature vector;
-
3.
stability of the emotion classification when the gender type of the GMM model is chosen incorrectly;
-
4.
stability test of the obtained GMM scores and finally determined emotional class for correctly set male or female genders.
The same testing sentence was processed to compare recognition scores of the GMM classifiers. This test passed for 500 times using the same set of the trained models. The sentence “Vlak už nejede” (No more train leaves today) was used for testing. It was expressed by two male and two female speakers in neutral and emotional speaking styles with mean duration of 1.5 s (which corresponds approx. to 125 frames for analysis). The length of the original feature vector was NFEAT = 16. For limited length of NFEAT = 12, the zero values were used at the positions 7, 9, 11, and 15 of the original feature vector. For the length the NFEAT = 8, the zero values were used at the positions 2, 3, 4, 7, 9, 11, 14, and 15.
Finally, we realized two experiments for verifying of our working hypothesis about:
-
1.
usability of the speech database in other language using the German database as a data source for GMM emotion training and testing (recognition);
-
2.
minimal influence of the order of parameters in the input feature vector on the GMM emotion classification score.
Verification of the second working hypothesis was realized within the framework of analysis of influence of the type of the feature vector and the order of features in the feature vector on the recognition error rate and the stability of the classifier.
3.1. Used types of features in the input vectors of the GMM classifier
As it was mentioned in Section 1, our research is focused mainly on analysis and comparison of basic and complementary spectral properties of the emotional speech including the prosodic—supra-segmental parameters.
For that reason, also in this experiment, these types of speech parameters were used as the input features for the emotion classification based on the GMM approach.
In the case of the spectral features, the basic statistical parameters—mean value, and standard deviation (std)—were used as the representative values in the feature vectors for GMM emotion and gender recognition. The special category of the spectral features is represented by coefficients of the real cepstrum[27]. The calculated histograms of distribution were used to determine the extended statistical parameters—skewness and kurtosis that were used in the feature vectors. For implementation of the supra-segmental parameters of emotional speech, the statistical types of median values, range of values, std, and/or relative maximum and minimum we used in the feature vectors.
For our experiments, we set up six basic feature sets and a special one as the input data vectors for GMM training and classification—see detailed description of their structure in Tables 1,2,3,4,5,6 and7:
-
1.
feature set containing only statistical values of supra-segmental parameters (P1);
-
2.
feature set consisting of extended statistical values of spectral parameters together with extended statistical values of supra-segmental parameters (P2);
-
3.
feature set including complete values of CSF and extended statistical values of supra-segmental parameters (P3);
-
4.
feature set containing a ratio of formant frequencies F 1, F 2, a formant tilt, values for all types of CSF, and extended values of supra-segmental parameters (P4);
-
5.
feature set including extended statistical parameters of the first three cepstral coefficients (c 1–c 3) together with basic values of CSF (excluding the HNR), and basic supra-segmental parameters (P5);
-
6.
feature set containing a mix of basic spectral parameters (skewness of the first four cepstral coefficients, a formant ratio, and a tilt), complete values of CSF, and basic supra-segmental parameters (P6);
-
7.
special feature set consisting of 32 values including extended mix of basic spectral parameters (a skewness and a kurtosis of the first four cepstral coefficients, formant ratios of the first three formant frequencies F 1, F 2, F 3, and formant tilts computed also from the first three formants), values for all types of CSF, and extended statistical values of supra-segmental parameters (P8).
Influence of the feature vector length on GMM emotion classification error rate was analyzed using the special feature set P8 consisting of 32 parameters. For verifying our working hypothesis about minimal influence of the feature order in the input data vector, the set P3 was used with the reversed order of features giving thus the set called P7.
3.2. Description of the used speech corpora and methods of processing of sentences
The speech material for building of the training and the testing data corpus was originated from two sources. The reference speech corpus was taken from the emotional speech database Berlin (EMO-DB)[32, 33] in German language. This speech corpus was chosen due to our prior analysis and comparison of spectral properties of emotional speech in German, Czech, and Slovak[34]. The EMO-DB speech database consists of a set of sentences with the same contents expressed in seven emotional styles: neutral, joy, sadness, boredom, fear, disgust, and anger. For our comparison we use only four emotional types in Czech & Slovak—neutral, joy, sadness, and anger. We extracted 95 sentences spoken by 5 male speakers, and 134 sentences spoken by 5 female speakers with duration from 1.5 to 8.5 s sampled at 16 kHz. The Czech and Slovak speech corpus was extracted from the fairy tales performed by professional actors. It contains sentences with different contents expressed in the mentioned four emotional styles uttered by several speakers (134 sentences spoken by male voices and 132 sentences spoken by female voices, 8 + 8 speakers altogether). The processed speech material consists of the sentences with a duration of 1.5–5.5 s, resampled at 16 kHz. Feature vectors were extracted from the EMO-DB corpus in 16,234 frames from male speakers, and 25,753 frames from female speakers. In the case of sentences from the Czech & Slovak speech corpus the number of the analyzed frames was 25,988 for male speakers and 24,017 for female speakers.
To obtain the input features of a sentence, the speech signal is pitch-asynchronously processed and analyzed in the frames of constant duration corresponding to the mean fundamental frequency of a speaker group (different for male/female speakers). Depending on the type of the feature, the resulting values are calculated either from the voiced frames of the analyzed utterance or from both voiced and unvoiced frames. The prosodic parameters were primarily determined from the F0 contour—therefore, the voicing classification of the analyzed frame must be performed first. On the border between the voiced and the unvoiced parts of the speech signal, a situation can occur when the frame is classified as voiced but the obtained value corresponds to the unvoiced class. For correction of this effect, the output values of the pitch-period detector are filtered by a 3-point recursive median filter.
The basic functions from the Ian T. Nabney “Netlab” pattern analysis toolbox[35, 36] were used for the creation of the GMM models, data training, and classification. The computational complexity was tested on the PC with following configuration: processor Intel(R) i3-2120 at 3.30 GHz, 8 GB RAM, and Windows 7 professional OS. This test compared the obtained CPU times for GMM creation and training phase in both genders, as well as the CPU times of emotion classification phases (neutral and three emotional styles for male/female gender). The mean CPU times for different lengths of feature vectors (8/16/32 values) were calculated as duration of the training phase summed with mean duration of the classification phase averaged for all four emotions and both genders.
3.3. Obtained results of performed experiments
Obtained recognition (classification) results are compared visually in the form of graphs as well as numerically in the form of tables (basic statistical values determined from the score parameters). The resulting graphs and data are ordered and grouped into the sets corresponding to the type of the performed experiments (see detailed description at the beginning part of this section):
-
influence of the used number of mixtures for GMM emotion classification of male and female voices and for male and female gender recognition—see bar graphs in Figures5 and6, and Tables 8 and9;

Influence of the used number of mixtures on GMM emotion classification; N iter = 1500, feature set P3.

Influence of the used number of mixtures on GMM gender recognition; N iter = 1500, feature set P3.
-
influence of the used number of training iterations during creation of the GMM models—results of classification of four emotions for male and female voices (Figures7 and8, and Tables 10 and11);

Influence of the used number of training iterations on the GMM emotion classifier; N gmix = 6, feature set P3.
-
influence of different length of the feature vector on GMM emotion classification and gender recognition error rate (see Figure9 and values in Table 12), and corresponding computational complexity (comparison of computing times in Table 13);
-
influence of the used type of the feature vector on GMM emotion classification of male and female genders, and male and female gender recognitions including the test of the order of the features in the input vector—comparison of the obtained recognition error rate in Figures10 and11, and Tables 14 and15;
-
results of the complete gender recognizer and emotional speech style classifier—see the confusion matrix in Figure12, and numerical results in Table 16.

Influence of the used number of training iterations on the GMM gender recognizer; N gmix = 3, feature set P3.

Influence of the features vector length for GMM emotion classification error rate; feature set P3 (with 8, and 16 values), and the set P8 (32 values), N gmix = 6, N iter = 1200.

Influence of the type of the feature vector on GMM emotion classification error rate; N gmix = 6, N iter = 1200.

Influence of the type of the feature vector on GMM gender recognition error rate; N gmix = 3, N iter = 1000.

Confusion matrix of the complete GMM emotion classifier; 1st level setting: feature set P4, N gmix = 3, N iter = 1000, 2nd level setting: feature set P3, N gmix = 6, N iter = 1200.
The second group of results consists of obtained values from performed stability test experiments including:

Influence of the input sentence length on stability of the GMM emotion classification process; obtained scores (upper set of graphs), determined class of emotion (bottom set); feature set P3, N gmix = 6, N iter = 1200; tested sentence expressed by the male speaker in sad style processed of parts in [frames] of 38, 68, and 96 (the whole sentence).

Influence of limited length of feature vector on stability of the GMM emotion classification process; obtained scores (upper set of graphs), determined class of emotion (bottom set); feature sets P3_8, P3_12, and P3_16, N gmix = 6, N iter = 1200; tested sentence expressed by the female speaker in joyous style.

Influence of incorrectly chosen GMM model of gender type on stability of the emotion classification; obtained scores (upper set of graphs), determined class of emotion (bottom set); feature set P3, N gmix = 6, N iter = 1200; tested sentence expressed in neutral speaking style by the male speaker (left two graphs), and by the female speaker (right graphs).

Stability test of the GMM emotion classifier for male gender; obtained scores (upper set of graphs), and finally determined class of emotion (bottom set); feature set P3, N gmix = 6, N iter = 1200; tested sentence expressed by the male speaker in neutral and emotional styles.
-
results of the influence of the length of the input processed sentence and the limited length of the feature vector on the stability of the GMM emotion classification process are shown in Figures13 and14;
-
analysis of the influence of incorrectly chosen GMM gender model on stability and correctness of the emotion classification (see sets of results for male/female genders in Figure15);
-
the final stability test – summary comparison of the GMM emotion classification process separately presented by a gender type—see sets of graphs in Figures16 and17.

Stability test of the GMM emotion classifier for female gender; obtained scores (upper set of graphs), and finally determined class of emotion (bottom set); feature set P3, N gmix = 6, N iter = 1200; tested sentence expressed by the female speaker in neutral and emotional styles.
Finally, the obtained results of comparison of emotion classification results for sentences from EMO-DB speech corpus and Czech & Slovak fairy tales are presented in the form of the integrated confusion matrix for male and female voices (Figure18), summary results of emotional speech style classification error rate in Table 17 together with comparison of gender type recognition (separate confusion matrices of gender recognition per emotion style in Figure19), and summary results of recognition error rate in Table 18.

Integrated confusion matrices of emotion classification for sentences from EMO-DB (left) and CZ&SK (right) corpora; feature set P3, N gmix = 6, N iter = 1200.

Confusion matrices of gender recognition for sentences from EMO-DB (upper set) and CZ&SK (bottom set) corpora; feature set P3, N gmix = 3, N iter = 1000.
4. Discussion of results
The first group of performed experiments was oriented on finding the optimum number of mixtures for GMM classification and the optimum number of iterations during the training process. In correspondence with our presupposition, the obtained results showed that the situation was different for emotion speech style classification and that for male and female gender recognitions (compare values of the error rate in Tables 8,9,10, and11). All tests in this step were realized using the feature set P3 which combines all three types of the speech parameters—basic spectral, CSF, and supra-segmental. For next analysis and processing, the following setting of parameters were consequently chosen: Ngmix = 6, Niter = 1200 for emotion classification and Ngmix = 3, Niter = 1000 for gender recognition.
From next comparison follows that obtained emotion classification error rate using only 8-parameters feature vector gives the mean value of 49.3%. However, error rates for emotions joy and anger were more than 50% what makes the whole classifier practically unusable. Comparison of attained mean error rates between classification with the help of the feature vector consisting of 32 values and with the basic length of 16 values gave ambiguous result (see Table 12 and bar diagram in Figure9). While the extension to 32 values brought a little improvement in the summary mean error rate of 24% compared with 27% error rate for the length of 16 values, in the case of emotions joy and anger the results were worse than in the case of the basic 16-parameters feature vector. On the other hand, the summary results of achieved computing times (CPU times) showed in Table 13 are in correspondence with expectancy (the maximum for overall GMM processing using the feature vector of 32 values and the minimum in the case of the length of 8 features). The consequence of change of the feature vector length from 16 to 32 causes increasing of the mean CPU time only by 18%, which is relatively negligible.
Our experimental work was primarily focused on analysis of different types of speech features for GMM emotion classification and gender recognition—as it can be seen in the bar graph in Figure10 and as follows from the summary results in Table 14, the best values are observed in the case of the P3 feature set (with the mean recognition error rate of about 26%). Very similar results are obtained also with the set P7. This partial result confirms our assumption that the succession of features in the input data vector has minimum influence on the recognition score (the set P7 has the same structure of features but in the reversed order when compared with the P3). Also the summary results of the obtained GMM gender recognition error rate stored in Table 15 are consistent with the previous statement. The P4 feature set was evaluated as the best one with the mean error rate of 13.45%. The bar graph in Figure11 shows that some types of features are entirely inappropriate for gender recognition—in the case of the set P5 and, first of all, in the case of the set P6 the error rate reaches more than 70%. These feature sets are different from the other ones that contain statistical values of the cepstral coefficients and the first two formants ratios. On the other hand, these values are useful for emotion classification—obtained scores and mean error rate values are near the best evaluation (classification) results of the P3 set.
Obtained results of the first experiment with a cascade connection of the GMM gender recognition block and the emotional style classification block (see Figure1) show that this approach is applicable and the obtained recognition error of the whole GMM classifier presented in Table 16 achieves acceptable values (the mean error rate for all four emotions and both voices is 21.13%). From the detailed results per emotions (see Figure12) follows that in correspondence with values obtained in the case of the separate recognition blocks, the problems occur in the neutral state of the female voice and in the joyful state of the male voice.
The performed emotion classification test confirmed good stability of the obtained GMM scores for the two observed sentences of male and female speakers, but on the other hand, the test showed that a principal problem can occur with wrong classification. As the score is a statistical variable containing probability/uncertainty, the results show variability which can cause erroneous emotion determination when the final score contains comparable values for more emotions. Therefore, we realized analysis of other factors with a potential effect on stability of the emotion classification. From the next test follows that the input sentence length plays a great role in recognition stability (see Figure13). When the number of features obtained from analysis of the tested sentence is less than 70, the resulting score produced by the GMM classifier is unstable, non-repeatable, and classification contains a lot of errors. It means that the minimum limit for proper function is approx. 90 signal frames of the processed input speech signal. Also the limitation of the length of the feature vector has a great influence on the correctness as well as the stability of the emotion classification (see Figure14). Results of this analysis show that the GMM classification using feature vectors with the length less than 12 values produces unacceptable error rate and this classifier would practically be inapplicable. Incorrectly chosen GMM model of gender type which is subsequently applied for emotion classification has no influence on stability but practically causes large error rate of emotion classification. It is documented in Figure15—the emotion class was evaluated wrong in all cases, when the gender type was set badly.
Finally realized comparison of emotion classification results for sentences from the EMO-DB speech corpus and the Czech & Slovak fairy tales shows that better results were achieved in the case of the EMO-DB. It holds also for obtained gender recognition error rate. The best results were achieved for the emotions of sadness and joy, the worst result was received for the emotion of anger (see values in Tables 17 and18). It is not entirely consistent with the results obtained from other authors using the EMO-DB database for GMM emotion recognition[37–39] as well as those published in more complex comparison studies[40, 41]. Usually, the best recognized emotions are anger and sadness followed by neutral state, the emotion joy generates the most confusion being recognized as anger[39]. Similar results were also achieved in classifications accomplished in[33], where the same emotional speech database was used. But these authors use features different from ours. For GMM recognition, they apply the features consisting first of all of the MFCC parameters, complemented with supra-segmental ones (mean, maximum, and minimum values of F0, the maximum steepness and dispersion of F0[37], intensity, low-pass intensity, high-pass intensity, etc.[40]).
For the Czech & Slovak database, the worst recognition rate was obtained also for the emotional style of anger but the best results were obtained for the neutral style. Using the EMO-DB, the overall mean error rate of emotion classification for both genders was 3.85% and the total error rate of male/female gender recognition was 3.94%. In the case of the Czech & Slovak database, the emotion classification error rate was 28.82% and the gender recognition error rate was 12.42%. This can be caused by the fact that our Czech & Slovak speech database is not balanced.
5. Conclusion
The performed experiments have successfully confirmed that the chosen conception of the two-level architecture of the whole GMM classifier is correct and the system is functional if the gender of the voice is determined properly. A critical issue is a correct function of the first block (the recognizer of the gender type) as the block of emotion determination operates with two different models trained for the male and the female voices. In the case of confusion, it occurs that probability (score) of correct determination of emotion type is decreased. The chosen type of a classifier is text-independent, i.e., it operates only with data (features) obtained from a speech signal. Incorporation of the input text information as an additional criterion for classification could help to increase the achieved error rate of the whole system.
The performed analysis of the influence of the initial parameters on creation and training of the GMM model shows that there is a substantial influence of the number of used mixtures in the context of the number of emotions (genders) that are to be recognized—the number of mixtures should be at least equal to the number of output recognized emotional states (genders). On the other hand, choice of the number of iterations has not great weight when its order is about hundreds; the optimum value is about 1,000.
The main point of our analysis consists in testing of the influence of the used type of the feature vector on the obtained GMM emotion recognition score. The aim was to find out the best (optimum) feature set for GMM emotion classification and gender recognition. However, this choice is not universal—it is necessary to use a different type for gender recognition and emotion classification. The set P3, evaluated as the best one, represents a mix of supra-segmental, spectral, and CSF features while later it appeared that the choice of the type of the statistical function is not substantial—as a rule, it is enough to use the basic statistical functions of mean or median, and the standard deviation.
Because our GMM classifier was developed for emotion recognition in continuous speech (sentences—not isolated words), observed limitation of the minimum length of the processed speech signal does not play essential role. In addition, it is supposed[3] that in the short parts of speech the emotions cannot adequately be expressed (excluding the anger one with high negative emotional load).
The overall results replicate, to a certain extent, the values obtained for individual blocks of the recognizer, i.e., the increased error rate (recognition error) in the case of the joy style for the male voice and the neutral style for the female voice. The worst identified emotional style is anger—it is assumed that it results from incorrect recognition of the male voice (due to higher F0 and other features for this emotion the male voice is confused for the female voice) and consequently a badly trained model is used for emotion recognition. Apparently, a similar but opposite situation occurs in the case of the emotion joy (i.e., the female voice is erroneously determined as the male one), however, it does not manifest so markedly.
In near future, we would like to supplement our speech corpus with another three emotions (boredom, surprise, and fear)—so that it would directly be comparable with the EMO-DB which we use as the reference one and to carry out the extension of the GMM classifier for these emotional states. Further, we want to implement the block of the recognizer in the language C++ for real-time applications running under the Windows (XP/Vista/Win7) platform. Later, we want to try an optimized variant in the mobile device of the type PDA/smartphone and Tablet.
Abbreviations
- CSF:
-
complementary spectral features
- EMO-DB:
-
emotional speech database Berlin
- EM:
-
expectation-maximization
- FFT:
-
fast Fourier transform
- F0:
-
fundamental frequency
- GPDF:
-
Gaussian probability density function
- GMM:
-
Gaussian mixture model
- HNR:
-
harmonics-to-noise ratio
- HMM:
-
hidden Markov models
- LPC:
-
linear predictive coding
- LT:
-
Linear trend
- MFCC:
-
Mel-frequency cepstral coefficients
- PSD:
-
power spectral density
- SC:
-
spectral centroid
- SFM:
-
spectral flatness measure
- SE:
-
spectral entropy
- std:
-
standard deviation.
References
Malins JG, Joanisse MF: The roles of tonal and segmental information in Mandarin spoken word recognition: an eyetracking study. J. Mem. Lang. 2010, 62: 407-420. 10.1016/j.jml.2010.02.004
Kinnunen T, Saeidi R, Sedlák F, Lee KA, Sandberg J, Hansson-Sandsten M, Li H: Low-variance multitaper MFCC features: a case study in robust speaker verification. IEEE Trans. Audio Speech 2012, 20(7):1990-2001.
Koolagudi SG, Nandy S, Rao KS: Spectral features for emotion classification, in Proceedings of IEEE International Advance Computing Conference (IACC ‘09). Patiala: India; 2009. pp. 1292–1296
Zhao X, Shao Y, DeL W: CASA-based robust speaker identification. IEEE Trans. Audio Speech 2012, 20(5):1608-1616.
Solera-Ureña R, García-Moral AI, Peláez-Moreno C, Martínez-Ramón M, Díaz-de-María F: Real-time robust automatic speech recognition using compact support vector machines. IEEE Trans. Audio Speech 2012, 20(4):1347-1361.
Herre J, Allamanche E, Hellmuth O: Robust matching of audio signals using spectral flatness features. In Proceedings of the 2001 IEEE Workshop on Applications of Signal Processing to Audio and Acoustics. New York, USA; 2001:127-130.
Madhu N: Note on measures for spectral flatness. Electron. Lett. 2009, 45: 1195-1196. 10.1049/el.2009.1977
Misra H, Ikbal S, Sivadas S, Bourlard H: Multi-resolution spectral entropy feature for robust ASR, in Proceedings of IEEE International Conference on Acoustics, Speech, and Signal Processing (ICASSP ‘05), vol.1. Philadelphia, PA: USA; 2005:253-256.
Roh YW, Kim DJ, Lee WS, Hong KS: Novel acoustic features for speech emotion recognition. Sci. China Ser. E: Technol. Sci. 2009, 52(7):1838-1848. 10.1007/s11431-009-0204-3
Hosseinzadeh D, Krishnan S: On the use of complementary spectral features for speaker recognition. EURASIP J. Adv. Signal Process. 2008, 2008(Article ID 258184):10.
Pérez-Espinoza H, Reyes-García CA, Villaseñor-Pineda L: Acoustic feature selection and classification of emotions in speech using a 3D continuous emotion model. Biomed. Signal Process. 2012, 7: 79-87. 10.1016/j.bspc.2011.02.008
Iriondo I, Planet S, Socoró JC, Martínez E, Alías F, Monzo X: Automatic refinement of an expressive speech corpus assembling subjective perception and automatic classification. Speech Commun. 2009, 51: 744-758. 10.1016/j.specom.2008.12.001
Fernandez R, Picard R: Recognizing affect from speech prosody using hierarchical graphical models. Speech Commun. 2011, 53: 1088-1103. 10.1016/j.specom.2011.05.003
Tsiakoulis P, Potamianos A, Dimitriadis D: Spectral moment features augmented by low order cepstral coefficients for robust ASR. IEEE Signal Process. Lett. 2010, 17(6):551-554.
Nicholson J, Takahashi K, Nakatsu R: Emotion recognition in speech using neural networks. Neural Comput. Appl. 2000, 9(4):290-296. 10.1007/s005210070006
Romport J, Matousek J: Formal prosodic structures and their application in NLP. In Text, Speech and Dialogue 2005, LNCS 3658. Edited by: Matousek V, Mautner P, Pavelka T. Berlin: Springer; 2005:371-378.
Nwe TL, Foo SW, De LC: Silva, speech emotion recognition using hidden Markov models. Speech Commun. 2003, 41: 603-623. 10.1016/S0167-6393(03)00099-2
Reynolds DA: Speaker identification and verification using Gaussian mixture speaker models. Speech Commun. 1995, 17: 91-108. 10.1016/0167-6393(95)00009-D
Yun S, Yoo CD: Loss-scaled large-margin Gaussian mixture models for speech emotion classification. IEEE Trans. Audio Speech 2012, 20(2):585-598.
He L, Lech M, Maddage NC, Allen NB: Study of empirical mode decomposition and spectral analysis for stress and emotion classification in natural speech. Biomed. Signal Process. 2011, 6: 139-146. 10.1016/j.bspc.2010.11.001
Bozkurt E, Erzin E, Erdem ÇE, Erdem AT: Formant position based weighted spectral features for emotion recognition. Speech Commun. 2011, 53: 1186-1197. 10.1016/j.specom.2011.04.003
Přibil J, Přibilová A: Application of expressive speech in TTS system with cepstral description. In Verbal and Nonverbal Features of Human-Human and Human–Machine Interaction 2007, LNAI 5042. Edited by: Esposito A, Bourbakis N, Avouris N, Hatrzilygeroudis I. Berlin: Springer; 2008:201-213.
Grůber M, Hanzlíček Z: Czech expressive speech synthesis in limited domain comparison of unit selection and HMM-based approaches. In TSD 2012, LNCS 7499. Edited by: Sojka P, Horak A, Kopecek I, Pala K. Berlin: Springer; 2012:656-664.
Přibil J, Přibilová A: Czech TTS Engine for BraillePen Device Based on Pocket PC Platform. In Proceedings of the 16th Conference Electronic Speech Signal Processing ESSP 05 joined with the 15th Czech-German Workshop Speech Processing. Prague, Czech Republic; 2005:402-408.
Přibil J, Přibilová A: Czech and Slovak speaking voice communicator based on PDA/smartphone device for handicapped people. In Proceedings of the International Conference on Applied Electronics. Plzen, Czech Republic; 2012:219-222.
Přibil J, Přibilová A: Spectral properties and prosodic parameters of emotional speech in Czech and Slovak. In Speech and Language Technologies. Edited by: Ipšić I. Rijeka, Croatia: InTech; 2011:175-200.
Vích R, Přibil J, Smékal Z: New cepstral zero-pole vocal tract models for TTS synthesis. In Proceedings of IEEE Region 8 EUROCON’2001, vol. 2. Bratislava, Slovakia; 2001:458-462.
Ilk HG, Eroğul O, Satar B, Özkaptan Y: Effects of tonsillectomy on speech spectrum. J. Voice 2002, 16: 580-586. 10.1016/S0892-1997(02)00133-9
Fant G: Speech Acoustics and Phonetics. Dordrecht, The Netherlands: Kluwer Academic Publishers; 2004.
Murphy PJ: Periodicity estimation in synthesized phonation signals using cepstral rahmonic peaks. Speech Commun. 2006, 48: 1704-1713. 10.1016/j.specom.2006.09.001
Silva DG, Olivera LC, Andrea M: Jitter estimation algorithms for detection of pathological voices. EURASIP J. Adv. Signal Process. 2009, 2009(Article ID 567875):9.
Berlin Database of Emotional Speech: Department of Communication Science, Institute for Speech and Communication. Berlin: Technical University; , Accessed 13 March 2006 http://pascal.kgw.tu-berlin.de/emodb/
Burkhardt F, Paeschke A, Rolfes M, Sendlmeier W, Weiss B: A database of German emotional speech. In Proceedings of Interspeech 2005. Lisbon, Portugal; 2005:1517-1520.
Přibil J, Přibilová A: Comparison of complementary spectral features of emotional speech for German, Czech, and Slovak. In Cognitive Behavioural Systems, LNCS 7403. Edited by: Esposito A, Hoffmann R, Hubler S, Wrann B. Heidelberg: Springer; 2012:236-250.
Nabney T: Netlab Pattern Analysis Toolbox. , Accessed 16 February 2012 http://www.mathworks.com/%20984%20Q2matlabcentral/fileexchange/2654-netlab
Bishop CM, Nabney IT: NETLAB Online Reference Documentation. , Accessed 16 February 2012 http://www.fizyka.umk.pl/netlab/
Truong KP, Leeuven DA: An ‘open-set’ detection evaluation methodology for automatic emotion recognition in speech. In ParaLing 2007: Workshop on Paralinguistic Speech—Between Models and Data. Saarbrücken, Germany; 2007:5-10.
Bitouk D, Verma R, Nenkova A: Class-level spectral features for emotion recognition. Speech Commun. 2010, 52: 613-625. 10.1016/j.specom.2010.02.010
Vondra M, Vích R: Recognition of emotions in German speech using Gaussian mixture models. In Multimodal Signals: Cognitive and Algorithmic Issues, LNAI 5398. Edited by: Esposito A, Hussain A, Marinaro M, Martone R. Berlin: Springer; 2009:256-263.
Shami M, Verhelst W: An evaluation of the robustness of existing supervised machine learning approaches to the classification of emotions in speech. Speech Commun. 2007, 49: 201-212. 10.1016/j.specom.2007.01.006
Kotti M, Paternò F: Speaker-independent emotion recognition exploiting a psychologically inspired binary cascade classification schema. Int. J. Speech Technol. 2012, 15: 131-150. http://link.springer.com/article/10.1007/s10772-012-9127-7#page-1 10.1007/s10772-012-9127-7
Acknowledgment
The study was supported by the Grant Agency of the Slovak Academy of Sciences (VEGA 2/0090/11), by the state project APVV-0513-10, and by the Ministry of Education of the Slovak Republic (VEGA 1/0987/12).
Author information
Authors and Affiliations
Corresponding author
Additional information
Competing interests
Both authors declare that they have no competing interest.
Authors’ original submitted files for images
Below are the links to the authors’ original submitted files for images.
Rights and permissions
Open Access This article is distributed under the terms of the Creative Commons Attribution 2.0 International License (https://creativecommons.org/licenses/by/2.0), which permits unrestricted use, distribution, and reproduction in any medium, provided the original work is properly cited.
About this article
Cite this article
Přibil, J., Přibilová, A. Evaluation of influence of spectral and prosodic features on GMM classification of Czech and Slovak emotional speech. J AUDIO SPEECH MUSIC PROC. 2013, 8 (2013). https://doi.org/10.1186/1687-4722-2013-8
Received:
Accepted:
Published:
DOI: https://doi.org/10.1186/1687-4722-2013-8