- Empirical Research
- Open access
- Published:
dEchorate: a calibrated room impulse response dataset for echo-aware signal processing
EURASIP Journal on Audio, Speech, and Music Processing volume 2021, Article number: 39 (2021)
Abstract
This paper presents a new dataset of measured multichannel room impulse responses (RIRs) named dEchorate. It includes annotations of early echo timings and 3D positions of microphones, real sources, and image sources under different wall configurations in a cuboid room. These data provide a tool for benchmarking recent methods in echo-aware speech enhancement, room geometry estimation, RIR estimation, acoustic echo retrieval, microphone calibration, echo labeling, and reflector position estimation. The dataset is provided with software utilities to easily access, manipulate, and visualize the data as well as baseline methods for echo-related tasks.
1 Introduction
When sound travels from a source to a microphone in an indoor space, it interacts with the environment by being delayed and attenuated due to the distance, and reflected, absorbed, and diffracted due to walls, ceiling, floor, furniture, and obstacles. The room impulse response (RIR) represents this phenomenon as a linear and causal time domain filter. As depicted in Fig. 1, RIRs are commonly subdivided into 3 parts [1]: the direct path, corresponding to the line-of-sight propagation; the early echoes, stemming from a few disjoint specular reflections on the closest reflectors, i.e., large flat surfaces, such as room walls; and the late reverberation comprising the dense accumulation of later reflections and scattering effects such as diffusion and diffraction due to the interactions with small objects and rough surfaces.

Example of room impulse response from dEchorate dataset
The late reverberation is indicative of the environment size and reverberation time, producing the so-called listener envelopment, i.e., the degree of immersion in the sound field [2]. In contrast, the direct path and the early echoes carry precise information about the scene’s geometry, such as the position of the source and room surfaces relative to the receiver position, and about the surfaces’ reflectivity. Such relation is well described by the image source method (ISM) [3], in which the echoes are associated with the contribution of virtual sound sources lying outside the real room. Therefore, one may consider early echoes as delayed and attenuated copies of the source signal, whose times of arrival (TOAs) are related to the source and reflector positions.
Based on this idea, methods that explicitly account for early echoes have been introduced a few decades ago; such methods are dubbed here as echo-aware. In the literature, they can be broadly classified into implicit and explicit approaches. Implicit approaches consider the so-called relative transfer function (RTF) [4], which is the ratio of the Fourier transform of two RIRs, otherwise stated, the ratio of the corresponding acoustic transfer functions. Such methods offer a notable advantage: many blind RTF estimation procedures are available, i.e., estimation from microphone observations only. Due to its ability to encode many of the acoustic propagation path properties, spatial processing techniques based on the RTF have been widely used for source separation and speech enhancement [4–7], as well as in sound source localization [8–11]. Explicit approaches instead require some sound propagation properties (e.g., echoes’ TOAs) to be known a priori. One of the early examples are the matched filters (or rake receivers) aiming at coherently sum the sound reflections [12–14] to enhance target signals. Later, these methods have recently regained interest as evidenced by the European project SCENIC [15] and the UK research project S3AFootnote 1. In fact, few studies showed that knowing the properties of a few early echoes could boost the performance of many indoor audio inverse problems such as speech enhancement (SE) [16, 17], sound source localization [18–21] and separation [22–25], and speaker verification [26].
Another fervent area of research spanning transversely the audio signal processing field is estimating the room geometry blindly from acoustic signals [27–30]. As recently reviewed by Crocco et al. in [29], end-to-end room geometry estimation (RooGE) involves a number of subtasks: The lowest common denominator of all these tasks is acoustic echo retrieval (AER), that is, estimating the properties of early echoes, such as their TOAs and energies. The former problem is typically referred to as TOA estimation, or time difference of arrival (TDOA) estimation when the direct path is taken as reference.
In order to develop and evaluate methods in all these fields, benchmark data are needed. As listed in [31] and in [32], a number of recorded RIRs corpora are freely available online, each of them meeting the demands of certain applications. Table 1 summarizes the main characteristics of some of them. One can broadly identify two main classes of echo-aware RIR datasets in the literature: SE/automatic speech recognition (ASR)-oriented datasets, e.g., [25, 31, 34], and RooGE-oriented datasets, e.g., [28–30]. ASR-oriented methods regard acoustic echoes indirectly, as highly correlated interfering sources coming from close reflectors, such as a table in a meeting room or a near wall. This typically presents a challenge in estimating the correct source’s direction of arrival (DOA) with further consequences in DOA-based enhancement algorithm. Although this factor is taken into account, the abovementioned datasets lack complete annotation of these echoes in the RIRs or the absolute position of objects inside the room. RooGE-oriented group typically features strong design choices, such as the usage of a single source, isolated microphones scattered across the room or expensive measurement equipment. These setups do not cover many end user ASR applications, such as those performed on table-top or hand-free communication devices. Therefore, the main common drawback of these echo-aware datasets is that they cannot be easily used for other tasks than the ones which they were designed for.
To circumvent the complexity of recording and annotating real RIR datasets, many works (e.g., [35, 36, 36–38]) resort to the extensive use of acoustic simulators based on the ISM, such as [39–42]. While such data are more versatile, simpler, and quicker to obtain, they fail to fully capture the complexity and richness of real acoustic environments. Consequently, methods trained, calibrated, or validated on them may fail to generalize to real conditions, as will be shown in this paper.
An exploitable echo-oriented RIR dataset should include a variety of environments (room geometries and surface materials), microphone placings (close to or away from reflectors, scattered or forming ad-hoc arrays), and, most importantly, precise annotations of the scene’s geometry and echo timings in the RIRs. Moreover, in order to be versatile and used in both SE and RooGE applications, geometry and timing annotations should be fully consistent. Such data are difficult to collect since it involves precise measurements of the positions and orientations of all the acoustic emitters, receivers, and reflective surfaces inside the environment with dedicated planimetric equipment.
To fill this gap, we present the dEchorate dataset: a fully calibrated multichannel RIR dataset with accurate annotation of the geometry and echo timings in different configurations of a cuboid room with varying wall acoustic profiles. The dataset currently features 1800 annotated RIRs obtained from 6 arrays of 5 microphones each, 6 sound sources, and 11 different acoustic conditions. All the measurements were carried out at the acoustic lab at Bar-Ilan University following a consolidated protocol previously established for the realization of two other multichannel RIRs datasets: the BIU’s Impulse Response dataset [33] gathering RIRs of different reverberation levels sensed by uniform linear arrays (ULAs) and MIRaGE [43] providing a set of measurements for a source placed on a dense position grid. The dEchorate dataset is designed for AER with linear arrays and is more generally aimed at analyzing and benchmarking RooGE and echo-aware signal processing methods on real data. In particular, it can be used to assess the robustness against the number of reflectors, the reverberation time, additive spatially diffuse noise, and non-ideal frequency and directive characteristics of microphone-source pairs and surfaces in a controlled way. Due to the amount of data and recording conditions, it could also be used to train machine learning models or as a reference to improve RIR simulators. The dataset is accompanied with a Python toolbox that can be used to process and visualize the data, perform analysis, or annotate new datasets.
The remainder of the paper is organized as follows. Section 2 describes the construction and the composition of the dataset, while Section 3 provides an overview of the data, studying the variability of typical acoustic parameters. To validate the data, in Section 4, two echo-aware applications are presented, one in speech enhancement and one in room geometry estimation. Finally, in Section 5, the paper closes with the conclusions and offers leads for future work.
2 Dataset description
2.1 Recording setup
The recording setup is placed in a cuboid room with dimension 6 m ×6 m ×2.4 m. The 6 facets of the room (walls, ceiling, floor) are covered by acoustic panels allowing controllable reverberation time (RT60). We placed 4 directional loudspeakers (direct sources, ID #1 to #4) facing the center of the room and 30 microphones mounted on 6 static linear arrays parallel to the ground. These elements are shown in Fig. 2, while a schematic view of the setup is shown in Fig. 3. An additional channel is used for the loop-back signal, which serves to compute the time of emission and detect errors. Each loudspeaker and each array is positioned close to one of the walls in such a way that the origin of the strongest echo can be easily identified. Moreover, their positioning was chosen to cover a wide distribution of source-to-receiver distances, hence, a wide range of direct-to-reverberant ratios (DRRs). Furthermore, 2 more loudspeakers (ID #5,#6) were positioned pointing towards the walls (indirect sources). This was done to study the case of early reflections being stronger than the direct path.

Pictures of the acoustic lab. From left to right: the overall setup, one microphone array, and the setup with revolved panels

Recording setup—top view
Each linear array consists of 5 microphones with non-uniform inter-microphone spacings of 4, 5, 7.5, and 10 cmFootnote 2. Hereinafter, we will refer to these elements as non-uniform linear arrays (nULAs).
2.2 Measurements
The main feature of this room is the possibility to change the acoustic profile of each of its facets by flipping double-sided panels with one reflective (made of Formica laminate sheets) and one absorbing face (made of perforated panels filled with rock wool). A complete list of the materials of the room is available in Section 6.1. This allows to achieve diverse values of RT60 that range from 0.1 to almost 1 s. In this dataset, the panels of the floor were always kept absorbent.
Two types of measurement sessions were considered, namely, one-hot and incremental. For the first type, a single facet was placed in reflective mode while all the others were kept absorbent. For the second type, starting from fully absorbent mode, facets were progressively switched to reflective one after the other until all but the floor are reflective, as shown in Table 2. The dataset features an extra recording session. For this session, office furnitures (chairs, coat hanger, and a table) were positioned in the room to simulate a typical meeting room with chairs and tables (see Fig. 4). Theses recordings may be used to assert the robustness of echo-aware methods in a more realistic scenario.

Broad view picture of the acoustic lab at Bar-Ilan University. This picture corresponds to the configuration 010001∗
For each room configuration and loudspeaker, three different excitation signals were played and recorded in sequence: chirps, white noise, and speech utterances. The first consists in a repetition of 3 exponentially swept frequency sine (ESS) signals of duration 10 s and frequency range from 100 Hz to 14 kHz interspersed with 2 s of silence. Such frequency range was chosen to match the loudspeakers’ characteristics. To prevent rapid phase changes and “pop” effects, the signals were linearly faded in and out over 0.2 s with a Tuckey taper window.Footnote 3 Second, 10-s bursts of white noise were played in the room. Finally, for each recording, 3 different anechoic speech utterances from the Wall Street Journal (WSJ) dataset [44] were used as source signal. Through all recordings, at least 40 dB of sound dynamic range compared to the room silence was asserted, and a room temperature of 24∘±0.5 ∘C and 80% relative humidity were registered. In these conditions, the speed of sound is cair=346.98 m/s [45]. In addition, 1 min of room tone (i.e., silence) and 4 min of diffuse babble noise were recorded for each session. The latter was simulated by transmitting different chunks of the same single-channel babble noise recording from additional loudspeakers facing the four room corners.
All microphone signals were synchronously acquired and digitally converted to 48 kHz with 32 bit/sample using the equipment listed in Table 3. The polarity of each microphone was recorded by clapping a book in the middle of the room, and their gain was corrected using the room tone.
Finally, RIRs are estimated with the ESS technique [46, 47] where the abovementioned exponential time-growing frequency sweep is used as probe signal. The interested reader can refer to [31, 48] for a detailed description of the ESS method and its advantages with respect to other measurement techniques. Then, the RIR is estimated by deconvolving the microphone signal, implemented as division in the frequency domainFootnote 4.
2.3 Dataset annotation
One objective of this dataset is to feature annotations in the “geometrical space,” namely the microphone, facet, and source positions, which are fully consistent with annotations in the “signal space,” namely the echo timings within the RIRs. This is achieved as follows:
-
(i)
First, the ground truth positions of the array and source centers are acquired via a Beacon indoor positioning system (bIPS). This system consists in 4 stationary bases positioned at the corners of the ceiling and a movable probe used for measurements which can be located within errors of ±2 cm.
-
(ii)
The estimated RIRs are superimposed on synthetic RIRs computed with the image source method (ISM) from the geometry obtained in the previous step. A Python GUIFootnote 5 (showed in Fig. 5) is used to manually tune a peak finder and label all the echoes corresponding to found peaks, that is, annotate t heir timings and their corresponding image source position and room facet label. A description of these tools is presented at the end of the section.
Fig. 5 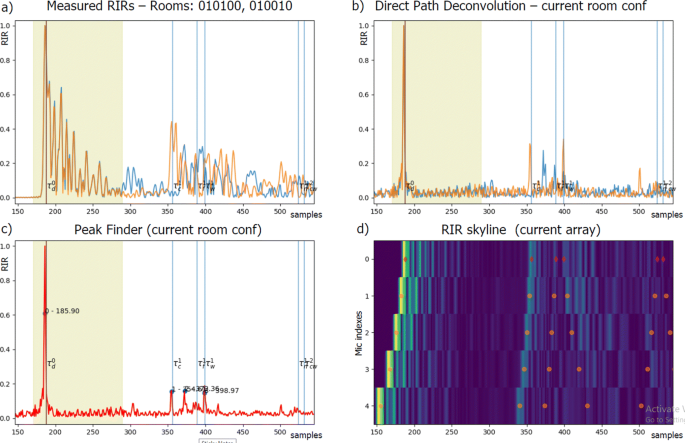
Detail of the GUI used to manually annotate the RIRs. For a given source and a microphone in an nULA, a and b show 2 RIRs for 2 different room configurations (blue and orange) before and after the direct path deconvolution. c The results of the peak finder for one of the deconvolved RIRs. d A detail on the RIR skyline (see Fig. 6) on the corresponding nULA, transposed to match the time axis
Fig. 6 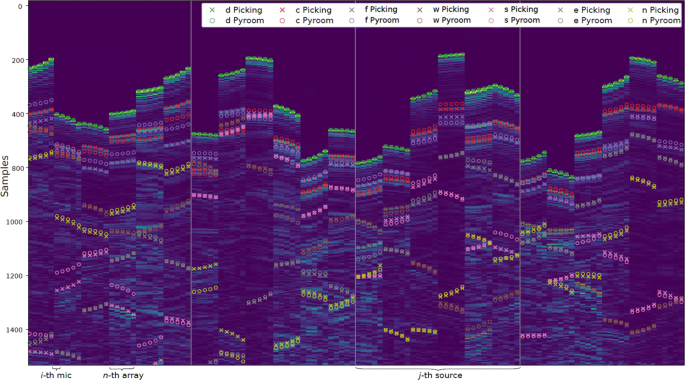
The RIR “skyline” described in Section 2.3, annotated with observed peaks (×) together with their geometrically expected position (∘) computed with the Pyroomacoustic acoustic simulator. As specified in the legend, markers of different colors are used to indicate the room facets responsible for the reflection: direct path (d), ceiling (c), floor (f), west wall (w), \(\dots \), north wall (n)
-
(iii)
By solving a simple multi-dimensional scaling (MDS) problem [49–51], refined microphone and source positions are computed from echo timings. The non-convexity of the problem is alleviated by using a good initialization (obtained at the previous step), by the high SNR of the measurements and, later, by including additional image sources in the formulation. The prior information about the arrays’ structures reduced the number of variables of the problem, leaving the 3D positions of the sources and of the arrays’ barycenters in addition to the arrays’ tilt on the azimuthal plane.
-
(iv)
By employing a multilateration algorithm [52], where the positions of one microphone per array serve as anchors and the TOAs are converted into distances, it is possible to localize image sources alongside the real sources. This step will be further discussed in Section 4.


Knowing the geometry of the room, in step (i), we are able to initially guess the position of the echoes in the RIR. Then, by iterating through steps (ii), (iii), and (iv), the position of the echoes is refined to be consistent under the ISM.
The final geometrical and signal annotation are chosen as a compromise between the bIPS measurements and the MDS output. While the former ones are noisy but consistent with the scene’s geometry, the latter ones match the TOAs but not necessarily the physical world. In particular, geometrical ambiguities such as global rotation, translation, and up-down flips were observed. Instead of manually correcting this error, we modified the original problem from using only the direct path distances (dMDS) to considering the image sources’ TOA of the ceiling as well in the cost function (dcMDS). Table 4 shows numerically the mismatch (in centimeters) between the geometric space (defined by the bIPS measurements) and the signal space (the one defined by the echo timings, converted to centimeters based on the speed of sound). To better quantify it, we introduce here a goodness of match (GoM) metric: it measures the fraction of (first-order) echo timings annotated in the RIRs matching the annotation produced by the geometry within a threshold. Including the ceiling information, dcMDS produces a geometrical configuration which has a small mismatch (0.4 cm on average, 1.86 cm max) in both the signal and geometric spaces with a 98.1% matching all the first order echoes within a 0.5-ms threshold (i.e., the position of all the image sources within about 17-cm error). It is worth noting that the bIPS measurements produce a significantly less consistent annotation with respect to the signal space.
Finally, the GUI mentioned in (ii) consists of a set of tools that were found useful in checking all the RIRs and annotating the echo TOAs in the dataset. These tools are listed below.
The “skyline” visualization consists in presenting the intensity of multiple RIRs as an image, such that the wavefronts corresponding to echoes can be highlighted [53]. Let hn(l) be an RIR from the dataset, where l=0,…,L−1 denotes sample index and n=0,…,N−1 is an arbitrary indexing of all the microphones for a fixed room configuration. Then, the skyline is the visualization of the L×N matrix H created by stacking column-wise N normalized echogramsFootnote 6, that is:
where ∣·∣ denotes the absolute value.
Figure 6 shows an example of skyline for 120 RIRs corresponding to 4 directional sources, 30 microphones, and the most reflective room configuration, stacked horizontally, preserving the order of microphones within the arrays. One can notice several clusters of 5 adjacent bins of similar color (intensity) corresponding to the arrivals at the 5 sensors of each nULA. Thanks to the usage of linear arrays, this visualization allowed us to identify both TOAs and their labeling.
Direct path deconvolution/equalization was used to compensate for the frequency response of the source loudspeaker and microphone [27, 54]. In particular, the direct path of the RIR was manually isolated and used as an equalization filter to enhance early reflections from their superimposition before proceed with peak picking. Each RIR was equalized with its respective direct path. As depicted in Fig. 5, this process was required for correctly identifying the underlying TOAs’ peaks.
Different facet configurations for the same geometry influenced the peaks’ predominance in the RIR, hence facilitating its echo annotation. An example of RIRs corresponding to 2 different facet configurations is shown in Fig. 5: the reader can notice how the peak predominance changes for the different configurations.
An automatic peak finder was used on equalized echograms |hn(l)| to provide an initial guess on the peak positions. In this work, peaks are found using the Python library peakutils whose parameters were manually tuned.
2.4 Limitations of current annotation
As stated in [55], we want to emphasize that annotating the correct TOAs of echoes and even the direct path in “clean” real RIRs is far from straightforward. The peaks can be blurred out by the loudspeaker characteristics or the concurrency of multiple reflections. Nevertheless, as showed in Table 4, the proposed annotation was found to be sufficiently consistent both in the geometric and in the echo/signal space. Thus, no further refinement was done. This dataset can be used as a first basis to develop better AER methods (see [29]) for a review), which could be used to iteratively improve the annotation, for instance including 2nd-order reflections.
2.5 The dEchorate package
The dataset comes with both data and code to parse and process it. The data are presented in 2 modalities: the raw data, that is, the collection of recorded wave files, are organized in folders and can be retrieved by querying a simple dataset table; the processed data, which comprise the estimated RIRs and the geometrical and signal annotations, are organized in tensors directly importable in Matlab or Python (e.g., all the RIRs are stored in a tensor of dimension L×I×J×D, respectively corresponding to the RIR length in samples, the number of microphones, of sources, and of room configurations).
Together with the data, a Python package is available on the same website. This includes wrappers, GUI, examples, and the code to reproduce this study. In particular, all the scripts used for estimating the RIRs and annotating them are available and can be used to further improve and enrich the annotation or as baselines for future works.
The dataset is available at [56], and the code to access and process the data is available at github.
3 Analyzing the data
In this section, we will illustrate some characteristics of the collected data in terms of acoustic descriptors, namely the RT60, the DRR, and the direct-to-early ratio (DER). While the former two are classical acoustic descriptors used to evaluate SE and ASR technologies [57], the latter is less common and used in strongly echoic situations [58, 59].
3.1 Reverberation time
For a given source-receiver pair in a room, the RT60 is defined as the time it takes for the sound level to decrease by 60 dB in the microphone signal just after the source has been turned off. It is used to quantify the reverberation phenomenon and is one the most common descriptor for room acoustics. Besides, as reverberation affects detrimentally the performances of speech processing technologies, the robustness against RT60 has become a common evaluation metric in SE and ASR.
Table 5 reports the estimated RT60(b) values per octave band b∈{500,1000,2000,4000} (Hz) for each room configuration in the dataset. These values were estimated using Schroeder’s integration methods [60–62] in each octave band. For the octave bands centered at 125 Hz and 250 Hz, the measured RIRs did not exhibit sufficient power for a reliable estimation. This observation found confirmation in the frequency response provided by the loudspeakers’ manufacturer, which decays exponentially from 300 Hz downwards.
Ideally, for the RT60 to be reliably estimated, the Schroeder curve, i.e., the log of the square-integrated, octave band-passed RIR, would need to feature a linear decay for 60 dB of dynamic range, which would occur in an ideal diffuse sound regime. However, such range is never observable in practice, due to the presence of noise and possible non-diffuse effects. Hence, a common technique is to compute, e.g., the RT10 on the range [−5,−15] dB of the Schroeder curve and to extrapolate the RT60 by multiplying it by 6.
For the dataset, we visually inspected all the RIRs corresponding to directional sources 1, 2, and 3, i.e., 90 RIRs in each of the 10 rooms. Then, two sets were created. Set \(\mathcal {A}\) features all the Schroeder curves featuring linear log-energy decays allowing for reliable RT10 estimates. Set \(\mathcal {B}\) contains all the other curves. In practice, 49% of the 3600 Schroeder curves were placed in the set \(\mathcal {B}\). These mostly correspond to the challenging measurement conditions purposefully included in our dataset, i.e., strong early echoes, loudspeakers facing towards reflectors, or receivers close to reflectors. Finally, the RT60 value of each room and octave band was calculated from the median of RT10 corresponding to Schroeder curves in \(\mathcal {A}\) only.
As can be seen in Table 5, obtained reverberation values are consistent with the room progressions described in Section 2. Considering the 1000-Hz octave band, the RT60 ranges from 0.14 s for the fully absorbent room (000000) to 0.73 s for the most reflective room (011111). When only one surface is reflective, the RT60 values remain around 0.19 s.
3.2 Direct to early and reverberant ratio
In order to characterize an acoustic environment, it is common to provide the ratio between the energy of the direct and the indirect propagation paths. In particular, one can compute the so-called DRR directly from a measured RIR h(l) [57] as:
where \(\mathcal {D}\) denotes the time support comprising the direct propagation path (set to ±120 samples around its time of arrival, blue part in Fig. 1), and \(\mathcal {R}\) comprises the remainder of the RIR, including both echoes and late reverberation (orange and green parts in Fig. 1).
Similarly, the DER defines the ratio between the energy of the direct path and the early echoes only, that is:
where \(\mathcal {E}\) is the time support of the early echoes only (green part in Fig. 1).
In contrast with RT60 which mainly describes the diffuse regime, both DER and DRR are highly dependent on the position of the source and receiver in the room. Therefore, for each room, wide ranges of these parameters were registered. For the loudspeakers facing the microphones, the DER ranges from 2 to 6 dB in one-hot room configurations and from − 2 to 6 dB in the most reverberant rooms. Similarly, the DRR has a similar trend featuring lower values, such as − 2 dB in one-hot rooms and down to − 7.5 dB for the most reverberant ones. A complete annotation of these metrics is available in the dataset.
4 Using the data
As an illustration of its wide range of potential uses, the dEchorate dataset is now used to investigate the performance of the state-of-the-art methods on two echo-aware acoustic signal processing applications on both synthetic and measured data, namely, spatial filtering and room geometry estimation.
4.1 Application: echo-aware beamforming
Let I be the microphones listening to a single static point sound source, contaminated by noise sources. In the short-time Fourier transform (STFT) domain, we stack the I complex-valued microphone observations at frequency bin f and time index t into a vector \(\mathbf {x}(f,t) \in \mathbb {C}^{I}\). Let us denote \(s(f,t) \in \mathbb {C}\) and \(\mathbf {n}(f,t) \in \mathbb {C}^{I}\) the source signal and the noise signals at microphones, respectively, which are assumed to be statistically independent. By denoting \(\mathbf {h} \in \mathbb {C}^{I}\) the Fourier transforms of the RIRs, the observed microphone signals in the STFT domain can be expressed a follows:
Here, the STFT windows are assumed long enough so that the discrete convolution-to-multiplication approximation holds well.
Beamforming is one of the most widely used techniques for enhancing multichannel microphone recordings. The literature on this topic spans several decades of array processing, and a recent review can be found in [63]. In the frequency domain, the goal of beamforming is to estimate a set of coefficients \(\mathbf {w}(f) \in \mathbb {C}^{I}\) that are applied to x(f,t), such that \(\hat {s}(f,t) = \mathbf {w}^{H} \mathbf {x}(f,t)\). Hereinafter, we will consider only the distortionless beamformers aiming at retrieving the clean target speech signal, as it is generated at the source position, that is \(\hat {s} \approx s\).
As mentioned throughout the paper, the knowledge of early echoes is expected to boost spatial filtering performances. However, estimating these elements is difficult in practice. To quantify this, we compare explicit and implicit echo-aware beamformers with echo-agnostic ones. In order to study their empirical potential, we will evaluate their performance using both synthetic and measured data, as available in the presented dataset.
Echo-agnostic beamformers do not need any echo-estimation step: they just ignore their contributions. The most striking example is the direct-path delay-and-sum beamformer (DS) [64] which, in far-field settings, requires the only knowledge of DOA of the target source.
Explicit echo-aware beamformers extend the direct-path beamformers by considering the multi-path propagation. They fall in the category of rake receivers, borrowing the idea from telecommunication where an antenna rakes (i.e., combines) coherent signals arriving from few different propagation paths [12–14]. To this end, they typically consider that for each RIR i, the delays and frequency-independent attenuation coefficients of R early echoes are known, denoted here as \(\tau _{i}^{(r)}\) and \(\alpha _{i}^{(r)}\), respectively. In the frequency domain, this translates into the following:
where r=0,…,R−1 denotes the reflection order. Recently, these methods have been used for noise and interferer suppression in [16, 65] and for noise and reverberation reduction in [17, 66]. The main limitation of these explicit echo-aware works is that echo properties, or alternatively the position of image sources, must be known or estimated a priori. Hereafter, we will assume these properties known by using the annotations of the dEchorate dataset, as described in Section 2.3. In particular, we will assume that the RIRs follow the echo model (5) with R=4, corresponding to the 4 strongest echoes, so that such echoes correspond all to first-order images. Then, knowing the echo delays, the associated frequency-independent attenuation coefficients can be retrieved from the observation using a simple maximum likelihood approach, as in [67, Eq. 10].
Implicit echo-aware beamformers aim at estimating the full acoustic propagation path (e.g., in [68–71]) or, alternatively, consider coupling filters between pairs of microphones, called RTFs [4]. The latter methods were introduced specifically to circumvent the need for blind estimation of echoes properties or RIRs. Note that contrary to RIRs, there exist efficient methods to estimate RTFs from multichannel recordings of unknown sources (see [63] (Section VI.B) for a review). On one hand, RTFs can then be naturally and easily incorporated in powerful beamforming algorithms for speech separation; on the other hand, this approach naturally estimates the source image as it is listened at the reference microphone; therefore, in its vanilla form, it is limited for the dereverberation application. More recent studies focuses, e.g., in [7, 72, 73], on how to achieve both dereverberation and noise reduction in various scenarios.
In this work, RTFs are estimated with known background noise statistics over 2 s of speech using the generalized eigenvector decomposition (GEVD) method [6], as illustrated in [74].
We evaluate the performance of both types of beamformers on the task of noise and late reverberation suppression. Different minimum variance distortionless response (MVDR) beamformers are considered, assuming either spatially white noise (i.e., classical DS design), diffuse noise (i.e., the Capon filter), or diffuse noise plus the late reverberation [7]. In the latter case, the late reverberation statistics are modeled by a spatial coherence matrix [75] weighted by the late reverberation power, which is estimated using the procedure described in [76].
Overall, the different RIR models considered are direct propagation (DP, i.e., ignoring echoes), multipath propagation (Rake, i.e., using 4 known early echoes) [16, 17], or the full reverberant propagation (RTF) [4, 74]. Table 6 summarizes the considered beamformer designs. All these methods are compared in their oracle setting, i.e., knowing the source’s DOA for DP, knowing the early echoes properties for Rake, and knowing the noise statistics for RTF.
Performance measures of the different designs are compared on the task of enhancing a target speech signal in a 5-channel mixture using the nULAs in the dEchorate dataset. They are tested in scenarios featuring high reverberation and diffuse babble noise, appropriately scaled to pre-defined signal-to-noise ratios SNR∈{0,10,20}. Using the dEchorate data, we consider the room configuration 011111 (RT60≈730 ms) and all possible combinations of (target, array) positions. Both real and corresponding synthetic RIRs are used, which are then convolved with anechoic utterances from the WSJ corpus [44] and corrupted by recorded diffuse babble noise. The synthetic RIRs are computed with the Python library pyroomacoustics [41], based purely on the ISM. Hence, on synthetic RIRs, the known echo timings perfectly match the components in their early part (no model mismatch).
The evaluation is carried out similarly to the one in [17] where the following metrics are considered:
-
The signal-to-noise-plus-reverberation ratio improvement (iSNRR) in dB, computed as the difference between the input SNRR at the reference microphone and the SNRR at the filter output. In the present study, SNRR is defined as the ratio between the target signal power and the power of the noise plus the power of late-reverberant target signal.
-
The speech-to-reverberation-energy-modulation ratio improvement (iSRMR) [77] to measure the dereverberation.
-
The Perceptual Evaluation of Speech Quality Improvement (iPESQ) score [78] to assess the perceptual quality of the signal and indirectly the amount of artifacts.
Implementations of the SRMR and Perceptual Evalution of Speech Quality (PESQ) metrics are available in the Python library speechmetrics. Both the iSNRR and the PESQ are relative metrics, meaning they require a target reference signal. Here, we consider the clean target signal as the dry source signal convolved with the early part of the RIR (up to the Rth echo) of the reference (first) microphone. On the one hand, this choice numerically penalizes both direct path-based and RTF-based beamformers, which respectively aim at extracting the direct path signal and the full reverberant signal in the reference microphone. On the other hand, considering only the direct path or the full reverberant signal would be equally unfair for the other beamformers. Moreover, including early echoes in the target signal is perceptually motivated since they are known to contribute to speech intelligibility [79]. Finally, the late reverberant signal for computing the SNRR is the dry source signal convolved with the late part of the RIR, assumed here to start 70 ms after the direct path’s TOA. Such values correspond to the average distance of 2nd-order image sources and was found to make the late reverberation well-approximated by the late diffusion model of [75].
Numerical results are reported in Fig. 7. On synthetic data, as expected, one can see that the more information is used, the better the performance measures are. Including late reverberation statistics considerably boosts performance in all cases. Both the RTF-based and the echo-aware beamformers significantly outperform the simple designs based on the direct path only. While the two designs perform comparably in terms of iSNRR and iPESQ, the former has a slight edge over the latter in terms of median iSRMR. A possible explanation is that GEVD methods tend to consider the stronger and more stable components of the RTFs, which in the considered scenarios may identify with the earlier portion of the RIRs. Moreover, since it is not constrained by a fixed echo model, the RTFs can capture more information, e.g., frequency-dependent attenuation coefficients. Finally, one should consider the compacity of the model (5) with respect to the RTF model in terms of the number of parameters to be estimated. In fact, when considering 4 echoes, only 8 parameters per channel are needed, as opposed to several hundreds for the RTF (ideally, as many as the number of frequency bins per channel).

Boxplot showing the comparison of different echo-agnostic and echo-aware (*) beamformers for the room configuration 011111 (RT60≈730 ms) on measured and synthetic data for all combinations of source array positions in the dEchorate dataset. The mean values are indicated as +, while whiskers indicates extreme values
When it comes to measured RIRs, however, the trends are different. Here, the errors in echo timings due to calibration mismatch and the richness of real acoustic propagation lead to a drop in performance for explicit echo-aware methods, both in terms of means and variances. This is clearest when considering the iPESQ metric, which also accounts for artifacts. The RTF-based beamformer considering late reverberation MVDR-RTF-Late outperforms the other methods, maintaining the trend exhibited on simulated data. Finally, conversely to the MVDR-RTF-Late, the MVDR-Rake-Late yields a significant portion of negative performances. As already observed in [17], this is probably due to tiny annotation mismatches in echo timings as well as the fact that their frequency-dependent strengths, induced by reflective surfaces, are not modeled in rake beamformers. This suggests that in order to be applicable to real conditions, future work in explicit echo-aware beamforming should include finer blind estimates of early echo properties from signals, as well as addressing the frequency-dependent behavior of attenuation coefficients. Towards the solution of the former problem, AER techniques investigated in [38, 80] aim at estimating echo TOAs with sub-Nyquist precision. However, preliminary experiments with these methods on dEchorate found them not to be reliable enough for automated annotation purpose.
4.2 Application: room geometry estimation
The shape of a convex room can be estimated knowing the positions of first-order image sources. Several methods have been proposed which take into account different levels of prior information and noise (see [30, 81] for a review). When the echoes’ TOA and their labeling are known for 4 non-coplanar microphones, one can perform this task using geometrical reasoning as in [28, 82–84]. In details, the 3D coordinates of each image source can be retrieved solving a multilateration problem [85], namely the extension of the trilateration problem to 3D space, where the goal is to estimate the relative position of an object based on the measurement of its distance with respect to anchor points. Finally, the position and orientation of each room facet can be easily derived from the ISM equations as the plane bisecting the line joining the real source position and the position of its corresponding image (see Fig. 8).

Image source estimation and reflector estimation for one of the sound sources in the dataset
In dEchorate, the annotation of all the first order echo timings are available, as well as the correspondences between echoes and room facets. This information can be used directly as input for the abovementioned multilateration algorithm. We illustrate the validity of these annotations by employing the RooGE technique in [28] based on them. This is done with known labels, bypassing any AER step.
Table 7 shows the results of the estimation of the room facets position in terms of plane-to-plane distance (distance error (DE), in centimeters) and plane-to-plane angle (angular error (AE), in degrees) between the real wall and the estimated one. The position of the surface is obtained using a single source and 6 microphones, one per array. The reported results are the mean over all the combinations of 6 microphones among the 30 ones, partitioned by arrays. Room facets are estimated using each of the sources #1 to #4 as a probe. Except for source #3, the majority of facets are estimated correctly in terms of their placement and orientation with respect to the coordinate system computed in Section 2.3. For instance, using source #4, all 6 surfaces were localized with 1.49 cm DE on average and their inclinations with 1.3∘ AE on average. These results are in line with the ones reported by Dokmanić et al. in [28] using a setup of 5 microphones listening to 1 sound source. Furthermore, one can use all the 4 sources to estimate the room geometry as suggested in [29]. By doing so, the entire room geometry estimation results in 1.15 cm DE and 2.6∘ AE on average.
The small errors are due to a concurrency of multiple factors, such as tiny offsets in the annotations. In the real recording room, some gaps were present between revolving panels in the room facet. In addition, it is possible that for some (image source, receiver) pairs, the far-field assumption is not verified, causing inaccuracies when inverting the ISM. The 2 outliers for source #3 are due to a wrong annotation caused by the source directivity which induced an echo mislabeling. When a wall is right behind a source, the energy of the related 1st reflection is very small and might not appear in the RIRs. This happened for the eastern wall, and a second-order image was taken instead. Finally, the contribution of multiple reflections arriving at the same time can result in large late spikes in estimated RIRs. This effect is particularly amplified when the microphone and loudspeakers exhibit long impulse responses. As a consequence, some spikes can be missclassified. This happened for the southern wall where again a second-order image was taken instead. Note that such echo mislabeling can either be corrected manually or using the Euclidean distance matrix criteria as proposed in [28]. Note that in the final annotation provided with the dataset, these cases are manually corrected. In particular, while the annotation of the image sources remains valid and reliable, the corresponding echo contributions as peaks in the RIRs are hidden. Consequently, the TOAs corresponding to these case are removed from the dataset annotation. Overall, this experiment illustrates well the interesting challenge of estimating and exploiting acoustic echoes in RIRs when typical sources and receivers with imperfect characteristics are used.
5 Conclusions and perspectives
This paper introduced a new database of room impulse responses featuring accurate annotation of early echo timings that are consistent with source, microphone, and room facet positions. These data can be used to test the methods in the room geometry estimation pipeline and in echo-aware audio signal processing. In particular, robustness of these methods can be validated against different levels of RT60,SNR, surface reflectivity, proximity, or early echo density.
This dataset paves the way to a number of interesting future research directions. By making this dataset freely available to the audio signal processing community, we hope to foster research in AER and echo-aware signal processing in order to improve the performance of existing methods on real data. Moreover, the dataset could be updated by including more robust annotations derived from more advanced algorithms for calibration and AER.
Finally, the data analysis conducted in this work brings the attention to exploring the impact of mismatch between simulated and real RIRs on audio signal processing methods. By using pairs of simulated vs. real RIRs available in the dataset, it should be possible to develop techniques to convert one to the other, using style transfer or domain adaptation techniques, thus opening the way to new types of learning-based acoustic simulators.
6 Appendix
6.1 Room materials (Table 8)
Availability of data and materials
The datasets generated and/or analyzed during the current study are available in the Zenodo repository (10.5281/zenodo.4626590) [56].
The code supporting the conclusions of this article is available in the public github repository.
Notes
I.e., [−12.25,−8.25,−3.25,3.25,13.25] cm w.r.t. the barycenter
The code to generate the reference signals and to process them is available together with the data. The code is based on the {pyrirtools} Python library.
The code to generate the reference signals and to process them is available together with the data. The code is based on the {pyrirtools} Python library.
This GUI is available in the dataset package.
The echogram is defined either as the absolute value or as the squared value of the RIR.
Abbreviations
- AE:
-
Angular error
- AER:
-
Acoustic echo retrieval
- ASR:
-
Automatic speech recognition
- DE:
-
Distance error
- DER:
-
Direct-to-early ratio
- DRR:
-
Direct-to-reverberant ratio
- DOA:
-
Direction of arrival
- ESS:
-
Exponentially swept frequency sine
- GEVD:
-
Generalized eigenvector decomposition
- GoM:
-
Goodness of match
- MDS:
-
Multi-dimensional scaling
- MVDR:
-
Minimum variance distortionless response
- nULA:
-
Non-uniform linear array
- PESQ:
-
Perceptual evalution of speech quality
- RIR:
-
Room impulse response
- RTF:
-
Relative transfer function
- TOA:
-
Time of arrival
- TDOA:
-
Time difference of arrival
- ISM:
-
Image source method
- SE:
-
Speech enhancement
- iPESQ:
-
Perceptual evaluation of speech quality improvement
- iSNRR:
-
Signal-to-Noise-plus-reverberation ratio improvement
- iSRMR:
-
Speech-to-reverberation-energy-modulation ratio improvement
- RooGE:
-
Room geometry estimation
- WSJ:
-
Wall Street Journal
References
H. Kuttruff, Room acoustics (CRC Press, Germany, 2016). https://doi.org/10.1201/9781315372150.
D. Griesinger, The psychoacoustics of apparent source width, spaciousness and envelopment in performance spaces. Acta Acustica U. Acustica. 83(4), 721–731 (1997).
J. B. Allen, D. A. Berkley, Image method for efficiently simulating small-room acoustics. J. Acoust. Soc. Am.65(4), 943–950 (1979). https://doi.org/10.1121/1.382599.
S. Gannot, D. Burshtein, E. Weinstein, Signal enhancement using beamforming and non-stationarity with applications to speech. IEEE Trans. Signal Process.49(8), 1614–1626 (2001). https://doi.org/10.1109/78.934132.
I. Cohen, Relative transfer function identification using speech signals. IEEE Trans. Speech Audio Process.12(5), 451–459 (2004). https://doi.org/10.1109/TSA.2004.832975.
S. Markovich, S. Gannot, I. Cohen, Multichannel eigenspace beamforming in a reverberant noisy environment with multiple interfering speech signals. IEEE Trans Audio Speech Lang. Process.17(6), 1071–1086 (2009). https://doi.org/10.1109/TASL.2009.2016395.
O. Schwartz, S. Gannot, E. A. Habets, Multi-microphone speech dereverberation and noise reduction using relative early transfer functions. IEEE/ACM Trans. Audio Speech Lang. Process.23(2), 240–251 (2014). https://doi.org/10.1109/TASLP.2014.2372335.
S. Braun, W. Zhou, E. A. Habets, in 2015 IEEE Workshop on Applications of Signal Processing to Audio and Acoustics (WASPAA). Narrowband direction-of-arrival estimation for binaural hearing aids using relative transfer functions, (2015), pp. 1–5. https://doi.org/10.1109/WASPAA.2015.7336917.
X. Li, L. Girin, F. Badeig, R. Horaud, in 2016 IEEE/RSJ International Conference on Intelligent Robots and Systems (IROS). Reverberant sound localization with a robot head based on direct-path relative transfer function, (2016), pp. 2819–2826. https://doi.org/10.1109/IROS.2016.7759437.
Q. Nguyen, L. Girin, G. Bailly, F. Elisei, D. -C. Nguyen, in Workshop on Crossmodal Learning for Intelligent Robotics in conjunction with IEEE/RSJ IROS. Autonomous sensorimotor learning for sound source localization by a humanoid robot (IEEENew York, 2018).
B. Laufer-Goldshtein, R. Talmon, S. Gannot, et al, Data-driven multi-microphone speaker localization on manifolds. Found. Trends Signal Process.14(1–2), 1–161 (2020).
J. L. Flanagan, A. C. Surendran, E. -E. Jan, Spatially selective sound capture for speech and audio processing. Speech Comm.13(1-2), 207–222 (1993). https://doi.org/10.1016/0167-6393(93)90072-S.
E. E. Jan, P. Svaizer, J. L. Flanagan, in IEEE International Symposium on Circuits and Systems, vol. 2. Matched-filter processing of microphone array for spatial volume selectivity, (1995), pp. 1460–1463. https://doi.org/10.1109/ISCAS.1995.521409.
S. Affes, Y. Grenier, A signal subspace tracking algorithm for microphone array processing of speech. IEEE Trans. Speech Audio Process.5(5), 425–437 (1997). https://doi.org/10.1109/89.622565.
P. Annibale, F. Antonacci, P. Bestagini, A. Brutti, A. Canclini, L. Cristoforetti, E. Habets, W. Kellermann, K. Kowalczyk, A. Lombard, E. Mabande, D. Markovic, P. Naylor, M. Omologo, R. Rabenstein, A. Sarti, P. Svaizer, M. Thomas, The SCENIC project: environment-aware sound sensing and rendering. Procedia Comput. Sci.7:, 150–152 (2011). https://doi.org/10.1016/j.procs.2011.09.039.
I. Dokmanić, R. Scheibler, M. Vetterli, Raking the cocktail party. IEEE J. Sel. Top. Signal Process.9(5), 825–836 (2015). https://doi.org/10.1109/JSTSP.2015.2415761.
K. Kowalczyk, Raking early reflection signals for late reverberation and noise reduction. J. Acoust. Soc. Am. (JASA). 145(3), 257–263 (2019). https://doi.org/10.1121/1.5095535.
F. Ribeiro, D. Ba, C. Zhang, D. Florêncio, in IEEE International Conference on Multimedia and Expo (ICME). Turning enemies into friends: using reflections to improve sound source localization, (2010), pp. 731–736. https://doi.org/10.1109/ICME.2010.5583886.
D. Salvati, C. Drioli, G. L. Foresti, Sound source and microphone localization from acoustic impulse responses. IEEE Signal Process. Lett.23(10), 1459–1463 (2016). https://doi.org/10.1109/LSP.2016.2601878.
D. Di Carlo, A. Deleforge, N. Bertin, in IEEE International Conference on Acoustics, Speech and Signal Processing (ICASSP). Mirage: 2D source localization using microphone pair augmentation with echoes, (2019), pp. 775–779. https://doi.org/10.1109/ICASSP.2019.8683534.
J. Daniel, S. Kitić, in IEEE International Conference on Acoustics, Speech and Signal Processing (ICASSP). Time domain velocity vector for retracing the multipath propagation, (2020), pp. 421–425. https://doi.org/10.1109/ICASSP40776.2020.9054561.
A. Asaei, M. Golbabaee, H. Bourlard, V. Cevher, Structured sparsity models for reverberant speech separation. IEEE/ACM Trans. Audio Speech Lang. Process.22(3), 620–633 (2014). https://doi.org/10.1109/TASLP.2013.2297012.
S. Leglaive, R. Badeau, G. Richard, Multichannel audio source separation with probabilistic reverberation priors. IEEE/ACM Trans. Audio Speech Lang. Process.24(12), 2453–2465 (2016). https://doi.org/10.1109/TASLP.2016.2614140.
R. Scheibler, D. Di Carlo, A. Deleforge, I. Dokmanić, in IEEE International Conference on Acoustics, Speech and Signal Processing (ICASSP). Separake: source separation with a little help from echoes, (2018), pp. 6897–6901. https://doi.org/10.1109/ICASSP.2018.8461345.
L. Remaggi, P. J. Jackson, W. Wang, Modeling the comb filter effect and interaural coherence for binaural source separation. IEEE/ACM Trans. Audio Speech Lang. Process.27(12), 2263–2277 (2019). https://doi.org/10.1109/TASLP.2019.2946043.
K. A. Al-Karawi, D. Y. Mohammed, Early reflection detection using autocorrelation to improve robustness of speaker verification in reverberant conditions. Int. J. Speech Technol.22(4), 1077–1084 (2019). https://doi.org/10.1007/s10772-019-09648-z.
F. Antonacci, J. Filos, M. R. Thomas, E. A. Habets, A. Sarti, P. A. Naylor, S. Tubaro, Inference of room geometry from acoustic impulse responses. IEEE Trans. Audio Speech Lang. Process.20(10), 2683–2695 (2012). https://doi.org/10.1109/TASL.2012.2210877.
I. Dokmanić, R. Parhizkar, A. Walther, Y. M. Lu, M. Vetterli, Acoustic echoes reveal room shape. Proc. Natl. Acad. Sci. U.S.A.110(30), 12186–12191 (2013). https://doi.org/10.1073/pnas.1221464110.
M. Crocco, A. Trucco, A. Del Bue, Uncalibrated 3D room geometry estimation from sound impulse responses. J. Frankl. Inst.354(18), 8678–8709 (2017). https://doi.org/10.1016/j.jfranklin.2017.10.024.
L. Remaggi, P. J. B. Jackson, P. Coleman, W. Wang, Acoustic reflector localization: novel image source reversion and direct localization methods. IEEE/ACM Trans. Audio Speech Lang. Process.25(2), 296–309 (2017). https://doi.org/10.1109/TASLP.2016.2633802.
I. Szoke, M. Skacel, L. Mosner, J. Paliesek, J. H. Cernocky, Building and evaluation of a real room impulse response dataset. IEEE J. Sel. Top. Signal Process.13(4), 863–876 (2019). https://doi.org/10.1109/JSTSP.2019.2917582.
A. F. Genovese, H. Gamper, V. Pulkki, N. Raghuvanshi, I. J. Tashev, in IEEE International Conference on Acoustics, Speech and Signal Processing (ICASSP). Blind room volume estimation from single-channel noisy speech, (2019), pp. 231–235. https://doi.org/10.1109/ICASSP.2019.8682951.
E. Hadad, F. Heese, P. Vary, S. Gannot, in 14th International Workshop on Acoustic Signal Enhancement (IWAENC). Multichannel audio database in various acoustic environments, (2014), pp. 313–317. https://doi.org/10.1109/IWAENC.2014.6954309.
N. Bertin, E. Camberlein, R. Lebarbenchon, E. Vincent, S. Sivasankaran, I. Illina, F. Bimbot, VoiceHome-2, an extended corpus for multichannel speech processing in real homes. Speech Commun.106:, 68–78 (2019). https://doi.org/10.1016/j.specom.2018.11.002.
C. Gaultier, S. Kataria, A. Deleforge, in Lecture Notes in Computer Science, vol. 10169 LNCS. VAST: the virtual acoustic space traveler dataset, (2017), pp. 68–79. https://doi.org/10.1007/978-3-319-53547-0_7.
C. Kim, A. Misra, K. Chin, T. Hughes, A. Narayanan, T. N. Sainath, M. Bacchiani, in Interspeech 2017. Generation of Large-Scale Simulated Utterances in Virtual Rooms to Train Deep-Neural Networks for Far-Field Speech Recognition in Google Home (ISCAStockholm, 2017), pp. 379–383.
L. Perotin, R. Serizel, E. Vincent, A. Guerin, CRNN-based multiple DoA estimation using acoustic intensity features for ambisonics recordings. IEEE J. Sel. Top. Signal Process.13(1), 22–33 (2019). https://doi.org/10.1109/JSTSP.2019.2900164.
D. Di Carlo, C. Elvira, A. Deleforge, N. Bertin, R. Gribonval, in IEEE International Conference on Acoustics, Speech and Signal Processing (ICASSP). Blaster: an off-grid method for blind and regularized acoustic echoes retrieval, (2020), pp. 156–160. https://doi.org/10.1109/ICASSP40776.2020.9054647.
S. M. Schimmel, M. F. Muller, N. Dillier, in IEEE International Conference on Acoustics, Speech and Signal Processing. A fast and accurate “shoebox” room acoustics simulator, (2009), pp. 241–244. https://doi.org/10.1109/ICASSP.2009.4959565.
E. A. Habets, Room impulse response generator. Technische Universiteit Eindhoven, Tech. Rep. 2(2.4), 1 (2006).
R. Scheibler, E. Bezzam, I. Dokmanić, in IEEE International Conference on Acoustics, Speech, and Signal Processing (ICASSP). Pyroomacoustics: a Python package for audio room simulations and array processing algorithms (Calgary, 2018). https://doi.org/10.1109/ICASSP.2018.8461310.
D. Diaz-Guerra, A. Miguel, J. R. Beltran, gpurir: a Python library for room impulse response simulation with GPU acceleration. Multimedia Tools Appl.80(4), 5653–5671 (2021). https://doi.org/10.1007/s11042-020-09905-3.
J. Čmejla, T. Kounovský, S. Gannot, Z. Koldovský, P. Tandeitnik, in European Signal Processing Conference (EUSIPCO). Mirage: multichannel database of room impulse responses measured on high-resolution cube-shaped grid, (2021), pp. 56–60. https://doi.org/10.23919/Eusipco47968.2020.9287646.
D. B. Paul, J. M. Baker, in Proceedings of the Workshop on Speech and Natural Language. The design for the Wall Street Journal-based CSR corpus (Association for Computational Linguistics, 1992), pp. 357–362. https://doi.org/10.3115/1075527.1075614.
O. Cramer, The variation of the specific heat ratio and the speed of sound in air with temperature, pressure, humidity, and co 2 concentration. J. Acoust. Soc. Am.93(5), 2510–2516 (1993). https://doi.org/10.1121/1.405827.
A. Farina, Simultaneous Measurement of Impulse Response and Distortion with a Swept-Sine Technique. Journal of The Audio Engineering Society (Audio Engineering Society, New York, 2000).
A. Farina, in Audio Eng. Soc. Convention (AES), 3. Advancements in impulse response measurements by sine sweeps, (2007), pp. 1626–1646.
M. Ravanelli, A. Sosi, P. Svaizer, M. Omologo, in European Signal Processing Conference (EUSIPCO). Impulse response estimation for robust speech recognition in a reverberant environment (IEEENew York, 2012), pp. 1668–1672.
I. Dokmanić, J. Ranieri, M. Vetterli, in European Signal Processing Conference (EUSIPCO). Relax and unfold: Microphone localization with Euclidean distance matrices (IEEENew York, 2015), pp. 265–269. https://doi.org/10.1109/EUSIPCO.2015.7362386.
M. Crocco, A. Del Bue, in IEEE International Conference on Acoustics, Speech and Signal Processing (ICASSP). Estimation of TDOA for room reflections by iterative weighted l1 constraint, (2016), pp. 3201–3205. https://doi.org/10.1109/ICASSP.2016.7472268.
A. Plinge, F. Jacob, R. Haeb-Umbach, G. A. Fink, Acoustic microphone geometry calibration. IEEE Signal Process. Mag., 14–28 (2016). https://doi.org/10.1109/MSP.2016.2555198.
A. Beck, P. Stoica, J. Li, Exact and approximate solutions of source localization problems. IEEE Trans. Signal Process.56(5), 1770–1778 (2008). https://doi.org/10.1109/TSP.2007.909342.
Y. E. Baba, A. Walther, E. A. P. Habets, 3D room geometry inference based on room impulse response stacks. IEEE/ACM Trans. Audio Speech Lang. Process.26(5), 857–872 (2018). https://doi.org/10.1109/TASLP.2017.2784298.
J. Eaton, N. D. Gaubitch, A. H. Moore, P. A. Naylor, Estimation of room acoustic parameters: the ACE challenge. IEEE/ACM Trans. Audio Speech Lang. Process.24:, 1681–1693 (2016).
G. Defrance, L. Daudet, J. -D. Polack, Finding the onset of a room impulse response: straightforward?IEEE/ACM Trans. Audio Speech Lang. Process.124(4), 248–254 (2008).
D. Di Carlo, P. Tandeitnik, C. Foy, N. Bertin, A. Deleforge, S. Gannot, Zenodo (2021). https://doi.org/10.5281/zenodo.4626590.
J. Eaton, N. D. Gaubitch, A. H. Moore, P. A. Naylor, in IEEE Workshop on Applications of Signal Processing to Audio and Acoustics (WASPAA). The ACE challenge–corpus description and performance evaluation, (2015), pp. 1–5. https://doi.org/10.1109/WASPAA.2015.7336912.
J. M. Eargle, in Handbook of Recording Engineering. Characteristics of performance and recording spaces (SpringerNew York, 1996), pp. 57–65.
P. A. Naylor, N. D. Gaubitch, Speech dereverberation (Springer, United Kingdom, 2010).
M. R. Schroeder, New method of measuring reverberation time. J. Acoust. Soc. Am.37(6), 1187–1188 (1965).
W. T. Chu, Comparison of reverberation measurements using schroeder’s impulse method and decay-curve averaging method. J. Acoust. Soc. Am.63(5), 1444–1450 (1978).
N. Xiang, Evaluation of reverberation times using a nonlinear regression approach. J. Acoust. Soc. Am.98(4), 2112–2121 (1995).
S. Gannot, E. Vincent, S. Markovich-Golan, A. Ozerov, A consolidated perspective on multi-microphone speech enhancement and source separation. IEEE/ACM Trans. Audio Speech Lang. Process.25(4), 692–730 (2017). https://doi.org/10.1109/TASLP.2016.2647702.
H. L. Van Trees, Optimum array processing: part IV of detection, estimation, and modulation theory (Wiley, United States, 2004).
R. Scheibler, I. Dokmanić, M. Vetterli, in IEEE International Conference on Acoustics, Speech and Signal Processing (ICASSP). Raking echoes in the time domain, (2015), pp. 554–558. https://doi.org/10.1109/ICASSP.2015.7178030.
H. A. Javed, A. H. Moore, P. A. Naylor, in IEEE International Conference on Acoustics, Speech and Signal Processing (ICASSP). Spherical microphone array acoustic rake receivers, (2016), pp. 111–115. https://doi.org/10.1109/ICASSP.2016.7471647.
L. Condat, A. Hirabayashi, Cadzow denoising upgraded: a new projection method for the recovery of Dirac pulses from noisy linear measurements. Sampling Theory Signal Image Process.14(1), 17–47 (2015). https://doi.org/10.1007/BF03549586.
M. Miyoshi, Y. Kaneda, Inverse filtering of room acoustics. IEEE/ACM Trans. Acoust. Speech Signal Process.36(2), 145–152 (1988). https://doi.org/10.1109/29.1509.
S. Gannot, M. Moonen, Subspace methods for multimicrophone speech dereverberation. EURASIP J. Adv. Signal Process.2003(11), 1–17 (2003). https://doi.org/10.1155/S1110865703305049.
J. Benesty, J. Chen, Y. Huang, J. Dmochowski, On microphone-array beamforming from a mimo acoustic signal processing perspective. IEEE Trans. Audio Speech Lang. Process.15(3), 1053–1065 (2007). https://doi.org/10.1109/TASL.2006.885251.
M. R. Thomas, I. J. Tashev, F. Lim, P. A. Naylor, in International Workshop on Acoustic Signal Enhancement (IWAENC). Optimal beamforming as a time domain equalization problem with application to room acoustics (IEEE, 2014), pp. 75–79. https://doi.org/10.1109/IWAENC.2014.6953341.
I. Kodrasi, S. Doclo, in Hands-free Speech Communications and Microphone Arrays (HSCMA). EVD-based multi-channel dereverberation of a moving speaker using different RETF estimation methods, (2017), pp. 116–120. https://doi.org/10.1109/HSCMA.2017.7895573.
N. Gößling, S. Doclo, in International Workshop on Acoustic Signal Enhancement (IWAENC). Relative transfer function estimation exploiting spatially separated microphones in a diffuse noise field, (2018), pp. 146–150. https://doi.org/10.1109/IWAENC.2018.8521295.
S. Markovich-Golan, S. Gannot, W. Kellermann, in European Signal Processing Conference (EUSIPCO). Performance analysis of the covariance-whitening and the covariance-subtraction methods for estimating the relative transfer function, (2018), pp. 2499–2503. https://doi.org/10.23919/EUSIPCO.2018.8553007.
M. Kuster, Objective sound field analysis based on the coherence estimated from two microphone signals. J. Acoust. Soc. Am.131(4), 3284–3284 (2012). https://doi.org/10.1121/1.4708280.
O. Schwartz, S. Gannot, E. A. Habets, in 24th European Signal Processing Conference (EUSIPCO). Joint estimation of late reverberant and speech power spectral densities in noisy environments using Frobenius norm, (2016), pp. 1123–1127. https://doi.org/10.1109/EUSIPCO.2016.7760423.
T. H. Falk, C. Zheng, W. -Y. Chan, A non-intrusive quality and intelligibility measure of reverberant and dereverberated speech. IEEE/ACM Trans. Audio Speech Lang. Process.18(7), 1766–1774 (2010). https://doi.org/10.1109/TASL.2010.2052247.
A. W. Rix, J. G. Beerends, M. P. Hollier, A. P. Hekstra, in IEEE International Conference on Acoustics, Speech, and Signal (ICASSP), vol. 2. Perceptual evaluation of speech quality (PESQ)-a new method for speech quality assessment of telephone networks and codecs, (2001), pp. 749–752. https://doi.org/10.1109/ICASSP.2001.941023.
J. S. Bradley, H. Sato, M. Picard, On the importance of early reflections for speech in rooms. J. Acoust. Soc. Am.113(6), 3233–3244 (2003). https://doi.org/10.1121/1.1570439.
H Peic Tukuljac, A. Deleforge, R. Gribonval, in Advances in Neural Information Processing Systems (NeurIPS), 31, ed. by S. Bengio, H. Wallach, H. Larochelle, K. Grauman, N. Cesa-Bianchi, and R. Garnett. MULAN: A Blind and Off-Grid Method for Multichannel Echo Retrieval (Curran Associates, Inc.New York, 2018). https://proceedings.neurips.cc/paper/2018/file/c9f95a0a5af052bffce5c89917335f67-Paper.pdf.
M. Crocco, A. Trucco, A. Del Bue, in IEEE International Conference on Acoustics, Speech and Signal Processing (ICASSP). Room reflector estimation from sound by greedy iterative approach, (2018), pp. 6877–6881. https://doi.org/10.1109/ICASSP.2018.8461640.
S. Tervo, T. Tossavainen, in IEEE International Conference on Acoustics, Speech and Signal Processing (ICASSP). 3D room geometry estimation from measured impulse responses, (2012), pp. 513–516. https://doi.org/10.1109/ICASSP.2012.6287929.
O. Shih, A. Rowe, in ACM/IEEE International Conference on Information Processing in Sensor Networks (IPSN). Can a phone hear the shape of a room?, (2019), pp. 277–288. https://doi.org/10.1145/3302506.3310407.
U. Saqib, S. Gannot, J. R. Jensen, Estimation of acoustic echoes using expectation-maximization methods. EURASIP J. Audio Speech Music (2020). https://doi.org/10.1186/s13636-020-00179-z.
A. Beck, P. Stoica, J. Li, Exact and approximate solutions of source localization problems. IEEE Trans. Signal Process.56(5), 1770–1778 (2008). https://doi.org/10.1109/TSP.2007.909342.
Acknowledgements
Luca Remaggi, Marco Crocco, Alessio Del Bue, and Robin Scheibler are thanked for their help during experimental design.
Funding
The visiting in Israel of DDC was founded by Rennes Métropole international mobility grants.
Author information
Authors and Affiliations
Contributions
Authors’ contributions
DDC collected and analyzed the data and performed all the evaluation related to the applications. PT supervised the data collection. CF performed the examination of the reverberation time. AD, NB, and SG supervised all the data collection and analysis process as well as the writing of the manuscript. All authors read and approved the final manuscript.
Authors’ information
The first author performed the work while visiting at Bar-Ilan University.
Corresponding author
Ethics declarations
Ethics approval and consent to participate
Not applicable.
Competing interests
The authors declare that they have no competing interests.
Additional information
Publisher’s Note
Springer Nature remains neutral with regard to jurisdictional claims in published maps and institutional affiliations.
Rights and permissions
Open Access This article is licensed under a Creative Commons Attribution 4.0 International License, which permits use, sharing, adaptation, distribution and reproduction in any medium or format, as long as you give appropriate credit to the original author(s) and the source, provide a link to the Creative Commons licence, and indicate if changes were made. The images or other third party material in this article are included in the article’s Creative Commons licence, unless indicated otherwise in a credit line to the material. If material is not included in the article’s Creative Commons licence and your intended use is not permitted by statutory regulation or exceeds the permitted use, you will need to obtain permission directly from the copyright holder. To view a copy of this licence, visit http://creativecommons.org/licenses/by/4.0/.
About this article

Cite this article
Carlo, D.D., Tandeitnik, P., Foy, C. et al. dEchorate: a calibrated room impulse response dataset for echo-aware signal processing. J AUDIO SPEECH MUSIC PROC. 2021, 39 (2021). https://doi.org/10.1186/s13636-021-00229-0
Received:
Accepted:
Published:
DOI: https://doi.org/10.1186/s13636-021-00229-0