- Research Article
- Open access
- Published:
Semantic Labeling of Nonspeech Audio Clips
EURASIP Journal on Audio, Speech, and Music Processing volume 2010, Article number: 404860 (2010)
Abstract
Human communication about entities and events is primarily linguistic in nature. While visual representations of information are shown to be highly effective as well, relatively little is known about the communicative power of auditory nonlinguistic representations. We created a collection of short nonlinguistic auditory clips encoding familiar human activities, objects, animals, natural phenomena, machinery, and social scenes. We presented these sounds to a broad spectrum of anonymous human workers using Amazon Mechanical Turk and collected verbal sound labels. We analyzed the human labels in terms of their lexical and semantic properties to ascertain that the audio clips do evoke the information suggested by their pre-defined captions. We then measured the agreement with the semantically compatible labels for each sound clip. Finally, we examined which kinds of entities and events, when captured by nonlinguistic acoustic clips, appear to be well-suited to elicit information for communication, and which ones are less discriminable. Our work is set against the broader goal of creating resources that facilitate communication for people with some types of language loss. Furthermore, our data should prove useful for future research in machine analysis/synthesis of audio, such as computational auditory scene analysis, and annotating/querying large collections of sound effects.
1. Introduction
Natural language is a highly complex yet efficient means of communication with great expressive power, and it is the primary mode of human communication and information exchange [1]. However, for people with language disabilities, speakers of minority languages in a setting where another language dominates, and learners of foreign languages, the linguistic channel of communication may be less effective. To compensate, nonverbal representations of concepts that people communicate about have been explored and evaluated as a means to support linguistic representations. These include animations and videos [2] and especially still pictures [3]. However, very little research has been done on the use of nonspeech audio to convey and express concepts in Augmentative and Alternative Communication (AAC).
Some research indicates that nonspeech audio perception may be impaired together with speech perception for people with specific pathological profiles because the process may share certain channel and brain regions [4]. But there is evidence that in many other cases, people who suffer language impairments (as after a stroke) still retain the ability to recognize environmental sounds [5, 6]. This work suggests that for both language-impaired populations and for healthy speakers whose comprehension is compromised for other reasons, nonspeech audio (environmental sounds) have the potential of conveying concepts and assisting language comprehension.
Compared to static images, audio perception may require a greater processing workload [7], as sound clips have temporal extension. However, the fact that additional time is required to finish listening to a sound clip is similar to that needed to finish viewing an animation or video. In fact, research [8] has shown that in some cases, sound can actually enhance vision perception, suggesting that adding nonspeech audio material may promote people's comprehension of visual languages. Moreover, some concepts, such as "thunder," are inherently auditory in nature and can be better described by a sound than by a picture.
Previous research (i.e., [9]) examined how environmental sounds are perceived in the human brain. However, not much work has been devoted to the question as to which semantic concepts are associated with nonspeech audio and how, as most of the auditory scene analysis and classification research focused on using automatic machine learning algorithms (e.g., [10, 11]). This question has motivated the work reported here, which concerns people's evocation of concepts with specific sounds. The majority of currently available nonspeech audio databases, such as the BBC Sound Effects Library that we used in our experiment, include sound labels provided by the recording engineers; the labels are therefore not based on discrimination and identification. The Freesound Project [12] asked volunteers to label submitted sounds but relatively few high quality labels were contributed. Marcell et al. [13] ran several studies gathering human labels and classification for 120 sounds produced by animals, people, musical instruments, tools, signals, and liquids. While it dovetails well with our own research, this work covered a much smaller sample of common concepts and focused on naming sound sources instead of semantic descriptions. Other studies [14] concentrated on a collection of human gestural contact sounds (scraping, hammering, etc.), but primarily looked at the human ranked similarity and categorization of these sounds, rather than looking at linguistic descriptions of the sounds.
In this paper, we describe a pilot study and a large-scale experiment devoted to collect human semantic labels for over 300 nonspeech sounds, which are specifically designed to convey a set of 184 familiar concepts referring to entities and events that can be linguistically expressed by different parts of speech. We examined the effectiveness with which the sound clips evoke concepts and the extent to which the labels we collected agree with the a priori labels. Three different attempts to categorize sounds into semantically coherent classes in terms of their auditory expressiveness allowed some conclusions, but failed for most of the hypothesized categories. Possible reasons for the failure to identify and associate sounds with target concepts are discussed.
2. Materials
This section describes the procedure of constructing a semantic network of concepts enhanced by nonspeech audio, including (1) a core vocabulary and (2) "soundnails" associated with each concept.
2.1. Vocabulary Selection
The broader goal of our research is to use nonspeech audio to improve language comprehension and acquisition for people facing language disabilities or language barriers so as to facilitate daily communication, and for language learning and language rehabilitation. We designed a "core vocabulary" that includes words needed to discuss common topics in daily communication covering the major parts of speech. The initial vocabulary came from Lingraphica [15], a commercial communication device developed by the Lingraphicare Company, for people with language impairments. It contains 1376 words (after stemming and eliminating symbols). We compared this initial vocabulary with the collection of words generated from the BBC Sound Effects Library [16] captions, which has 1368 words after stemming and without nonlinguistic symbols. For the overlapping Vocabulary between Lingraphica and BBC library (and after the removal of function words like articles and prepositions), words were divided according to their parts of speech. For those which can be assigned to multiple parts of speech (like "walk" and "thunder"), only the more frequent sense (based on WordNet [17]) was kept. The final word inventory included 211 nouns, 68 verbs, 27 adjectives, and 16 adverbs (http://soundnet.cs.princeton.edu/OMLA/study/HearMe_Mturk/quality_control/ViewCount.php?fn=all_noun_211.txt (fn=all_verb_68.txt, all_adj_27.txt, and all_adv_16.txt for different parts of speech)).
2.2. Creating the Soundnails
We chose the BBC Sound Effects Library (Original Series) [16] as our principal source for the nonspeech audio representations because it provides a large enough vocabulary that can overlap with the core of our initial vocabulary for a variety of auditory events and scenes with high quality, cleanly recorded, sound clips. The BBC Sound Effects Library contains 40 CDs of industry standard high-quality sound clips recorded and labelled by BBC's top engineers. The sounds range from more general scenes like interior and exterior environments, household, and natural environments to more specific categories like cars, hospital, birds, weather, and so forth. All the sounds in the library are labelled in great detail, for example, "Gale Force Wind And Rain On Yacht (Recorded In Cabin)," and "Car, Rolls Royce Silver Sprite, Interior, Electrical Window, Open and Close."
Despite its size, this collection did not include auditory representations for all the words in our vocabulary. We looked into other resources as well, including the Freesound Project [12] and the FindSounds website [18]. The Freesound Project is a collaborative database where volunteers submit and label sounds they record. The FindSounds website is a search engine for online audio. Compared to the BBC Sound Effects Library, audio clips from these two resources have bigger variance and are less reliable in both quality and labels.
2.2.1. Concept-Audio Association
Having established a core vocabulary and a collection of nonspeech audio, our next step was to draw meaningful associations between concepts and sounds. Intuitively, almost half of the words in the vocabulary seemed to be difficult to be illustrated by sound. To filter our list to words that are good candidates for audio representation, five people from the Princeton Human Computer Interface and SoundLab gave an "audioability" (the ability to be conveyed by nonspeech audio) rating for each word. A four-point rating scale was used (Table 1), and each judge wrote a script of what kind of sound can illustrate the given concept for words with a rating 2 or 3.
Of the 322 words, 184 of them received a rating of 2 or higher, which means that they are considered "audioable." Two additional SoundLab members joined the discussion and finalized the sound scripts for these 184 target words (one script for each word). Those scripts formed the guidelines for selecting and assigning sound clips based on their original labels. A target word could be assigned to more than one sound.
2.2.2. Soundnail Creation
The majority of the BBC sound effects are dozens of seconds long, and many even last several minutes; this is also the case for the clips obtained from Freesound and FindSounds. These long clips carry richer and more complex information than can be conveyed by a single concept. For the applications we have in mind, such scripts are not suitable. Another problem is the size of the clips. They are high-resolution stereo files, which makes them difficult to store and load. For practicality and quality control, we edited all files to uniform length and down-sampled all selected clips to 16 kHz, 16 bit mono, which is a sample rate at which people can still well recognize the sound scene. Our 16 kHz sample rate decision was based on the fact that many games (especially mobile/handheld) use 11.025 or 22.05 kHz sample rate, and the speech recognition community has historically used 16 kHz for recognizers. It was critical to keep file sizes small for web transmission to our test subjects (see below), and we could not guarantee that they would have the proper mpeg/other audio decompressor installed and working on their computers. Our committee concluded that 16 kHz, 16 bit audio was of acceptable quality, and this was verified in a pilot study [14]. All sound clips were randomly chunked into five-second fragments, as it was desired to keep files short, of the same length to balance the experimental conditions, but long enough to still embed enough information.
Signal Processing and Machine Learning algorithms were applied to select the representative fragment (one that contains the most distinctive information). All five-second fragments were represented in the frequency domain, and six features (Mean and standard deviations of RMS Energy, Spectral Centroid, Spectral Flux, 50% and 80% rolloff, and 6–10 MFCCs) reflecting different characteristics were extracted (Table 2) [19]. Later, for each original sound clip, all the fragments were clustered into three to four groups by K-Means algorithm based on the extracted features. The fragment that was the closest to the center of its cluster was selected as the representative for the group. After automatic processing, up to four candidates (depending on the complexity and variance of the sound scene) "soundnails" (short representative sound clips) were generated for each sound clip. Each soundnail included certain characteristic sounds. In the last step, project group members examined all candidates and selected one as the representative to be associated with the target concept.
A total of 327 5-second soundnails were generated and assigned. All soundnails are of the same power, except in specific cases requiring lower or higher volume, such as sound from far away sources.
3. Experiments
Experiments were designed and conducted to collect human semantic labels for all the soundnails included in our vocabulary. Our goals in analyzing the collected responses were to determine
-
(i)
first, whether the soundnails actually convey the intended concepts;
-
(ii)
second, if not, what concept people agree on instead;
-
(iii)
third, for disagreements among the labellers, what causes the ambiguity and how can it help to select better auditory representations.
Labeling 327 sounds is an intensive task. Furthermore, to leverage individual differences and generalize meaningful semantic labels, a large number of human participants is required, which makes it impractical and expensive to carry out such a study in a controlled lab environment. Therefore, we decided on an alternative, conducting an online survey on the platform provided by Amazon Mechanical Turk (AMT) [20].
3.1. Tasks and Interface
The purpose of the experiments is to collect free form human labels for soundnails. In order to encourage people to come up with as much information across different parts of speech as possible, participants were asked to answer three questions, targeting sources, locations, and actions, respectively, after listening to the soundnail.
-
(1)
What is the source of the sound? (What object(s)/living being(s) is/are involved?)
-
(2)
Where are you likely to hear the sound?
-
(3)
How is the sound made? (What action(s) is/are involved in creating the sound?)
Figure 1 shows the experiment interface. The interface is web-based, and the sound automatically starts once the page is loaded. Subjects could replay the sound as desired.

Sound labeling experiment interface.
3.2. Controlled Pilot Study with HCI Students
Although the main study was conducted online, we carried out a pilot study in advance to test and modify the study interface (e.g., autoplay of the sound and phrasing of the questions) and generate ground truth human labels for quality control of the online study (details see the next section).
Twenty-two Princeton undergraduate students from the Human Computer Interface (HCI) Technology class participated in the pilot study. Five to eight labels were produced for each soundnail, and the time to label each soundnail was automatically logged as well. A poststudy questionnaire was given to gather feedback on the design and interface of the experiment.
3.3. Online Sound Labelling Study on Amazon Mechanical Turk
Amazon Mechanical Turk (AMT) is a web platform operated by Amazon, where people can post web-based surveys in which people all over the world can take part, requiring only an Amazon account. AMT provides services including account management, task management, participant control, and participation payment transaction.
In our sound labelling study, soundnails were shuffled and randomly grouped into 32 assignments of 10 to 11 sounds each, noted as Human Intelligence Tasks (HITs) by AMT. The size of the HIT was based on the response time logged in the pilot study, which avoids an overly long or tiring task. We requested at least 100 people to label each HIT, and no one person could label the same HIT twice. On average, the completion time per HIT was 14.64 minutes. The completion of the experiment took 97 days. Individual completion time per sound was logged.
3.3.1. Participants
Although AMT does not provide any identity and demographic information for the participants, we collected the geographic location for a sample of the participants (Table 3). People from 46 countries took part in the experiment, which suggested that our results had universal and culture-independent validity.
3.3.2. Quality Control
Since the AMT experiment was conducted online, we had no control over the environment of the participants and their honesty. Four schemes were applied to control the quality of the data we collected.
-
(1)
On the front of the experiment page, we specified the hardware and software requirements, and provided instructions and links to help people set up for the study (Figures 2(a) and 2(b)).
-
(2)
Before subjects could proceed to the actual study, there was a login page with auditory captcha of a person reading a sequence of letters and numbers. Subjects were required to enter what had been said correctly in order to access the experiment page (Figure 2(c)). This step ensures that people can hear the sound properly and listen carefully, avoiding a situation where "robots" hack into the system.
-
(3)
At the beginning of each HIT, an instruction clip was played, demonstrating what kind of sound would be played, and how to answer the three questions. Participants were asked to put down mandatory words at specified places as a practice. This step ensures to further check the sound system and to avoid automatically generated and thus invalid responses; it also helps participants to familiarize themselves with the interface and gives an idea of the desired level of description detail.
-
(4)
Once labels were submitted, our system compared the new results with the ground truth data from the pilot study to ensure that people were actually paying attention to the study and that meaningful labels were assigned. Finally, a manual review determined whether to accept or reject the work.
Figure 2 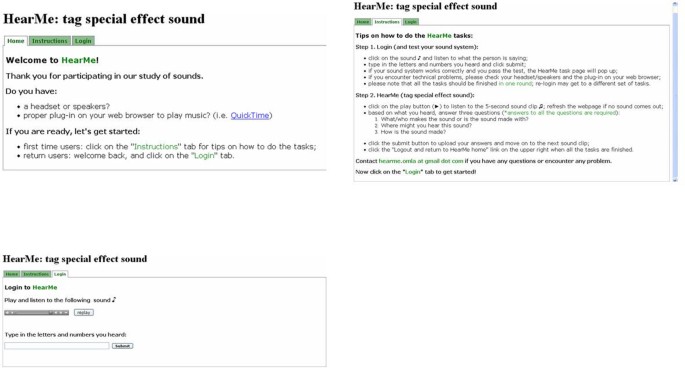
Quality controls. Hardware and software examinationInstructionsLogin and capcha

4. Data Processing and Generation of Sense Sets
After the AMT online sound labelling study was completed, each soundnail had been labelled by at least 100 (up to 174) participants. All labels were in sentence format. To facilitate analysis and evaluation, the semantic human label data were processed as follows.
Each sentence was broken down into bags of words. Function words that do not contain much information, such as "the," "and," and so forth, were filtered out. The raw data contained inflected words that we stemmed (reduced to their base forms) with the help of WordNet [17] and the Natural Language Toolkit [21]. Each unstemmed word was first looked up in WordNet, an online lexicon database, to see if it has a meaning independent of the base form; if this was not the case, it was stemmed. For example, "woods" meaning "forest" was not reduced to "wood," since it has its own meaning, while "pens" was transformed back to "pen." Following these steps, each sound was associated with a set of validated words.
For each sound, the total number of times each valid word appears was counted across all labellers. This number is referred as "word count" in the following sections. Figure 3 shows the top five word counts for the three soundnails associate with target word "train." This suggests that the concepts that people associated varied according to the particular sound scene (three in this example) even though they have the same source.

Word count examples for the three sounds for train.
The average number of valid words generated per person per sound is calculated. It is indicative of much information a sound can evoke, that is, how descriptive a sound is. Table 4 shows the ten most descriptive and the ten least descriptive sounds. The sounds are listed as "target word, description". For example, "Cat, Persian Meowing" is a soundnail for the word "cat," and it renders a Persian cat meowing. It is interesting to see that nine out of the ten sounds that have the lowest word count are generated by living beings (human or animal) or natural phenomena (such as wind), suggesting that natural sounds tend to be more distinctive. Also, more descriptive sounds (e.g., a doorbell ringing) only involve one source with no interaction among objects. In these cases, fewer words are needed to explain how the sounds were generated. By contrast, sounds with high average word counts could be associated with a more complex scene (such as zoo and school), or with several possible sources (such as heaviness).
Within the "bag of words" for a given sound, different words were often used to denote the same or very similar concept. In this sense, it seemed meaningful to group those words together as a "sense set" (or concept group) when considering what concepts the sound evoke. To be convenient, in the following sections, a sense set will be referred as a "label" to be distinguished from "word." If not specified, all the calculations and evaluations described below are based on labels instead of words.
There are three cases how words can be grouped into labels.
-
(1)
Synonym sets, in which words have the same meaning. For example, "baby," "infant," and "newborn" are group into the "baby" sense set, labelled with the most frequently used word "baby."
-
(2)
Similar senses expressed by words from different parts of speech. For example, "rain (noun)," "raining (verb)," and "rainy (adj.)" are grouped into the "rain" sense set.
-
(3)
Hyponym and hypernym (super- and subordinates). This varied case by case. For example, for the sound "ball", "basketball," "tennis ball", "ping pong ball" will all be put in the "ball" sense set, while for the sound "basketball", the word "basketball" had its own sense set.
A weight is calculated for each member word in the sense set based on their actual word count. In this process, misspelled words were corrected and taken into account.
5. Evaluation Metrics
Since a word count depends on the number of participants who labelled the sound and thus varied across sound, a relative score, referred as "Sense Score" is calculated for each sense set per sound. It is the average number of times across all labellers with which a sense set (label) is generated for a sound. Thus, the sense score shows how much participants agree on a label

For example, a score of 0.5 means 50% of the participants generate the label (sense set) once, and a score of 2 means on average each person used the label twice. The estimate of the highest sense score is 3, meaning that each person used the label once for answering each of the three questions. Figure 4 is an example of sorted sense score distribution for a sound.

Examples of a sorted sense score distribution. Each point on the x-axis is a label (sense set); the corresponding y-axis value is the sense score for the label."Skip, tape""Umbrella, Opening Umbrella"
Based on the sense score distribution, statistical descriptors can be calculated. The evaluation metrics (non-statistical and statistical) we looked at in our primary analysis include the following.
-
(1)
Top score: the highest sense score for each sound. It shows the extent to which participants agreed on the most agreed-upon word. It is the highest
 -axis value in a sense score distribution plot.
 -
(2)
Label number: the total number of labels (sense sets) generated for each sound. It is the highest
 -axis value in a sense score distribution plot.
 -
(3)
Mean score and standard diviation: mean and stdev of the sense scores.
-
(4)
Steepness: this measure shows quickly the sense scores drop across labels. Usually, the flatter the sense score distribution is, the less clearly the sound is associated with a single concept.
 -axis value in a sense score distribution plot.
 -axis value in a sense score distribution plot.
Correlation coefficients between the the metrics were computed. The correlation (Figure 5) between top score and label number is about −0.7, which means in general, the more people agree on a concept, the fewer labels are generated. Figure 6 hows that there is a strong correlation (>0.9) between top score, mean score, standard deviation, and steepness. As a result, we can simply use top score and label number for evaluating how well a sound can convey a concept.

Correlation between top score and label number.

Correlation between mean score (a) and steepness (b) and top score.
6. Primary Analysis
Figure 7 shows the histograms for top score (a) and label number (b) across all sounds. These suggest that most of the sounds conveyed a certain concept (over 300 sounds have a top score greater than 0.5, meaning that over half of the people use the same label).

Histograms of top score (a) and label number (b) across all sounds.
6.1. Audio Expressiveness
We provide some evaluation of the data. Table 5 lists the ten sounds with the highest top score and the ten sounds with the lowest top score. A high top score means people have a very similar idea on what the sound is about, while a low top score means people have very different opinions. The former indicates that sounds are distinctive and can easily be associated with a concept. The latter indicates that sounds are ambiguous and can easily be associated with more than one sound.
6.2. Effectiveness in Illustrating Target Concepts
Since a major goal of our study is to determine whether the soundnails can illustrate target concepts, the sense scores of target sense set were extracted and compared to the sense sets showing the highest agreement among the participants. The results can be categorized into four kinds of situations, exemplified in Table 6.
-
(1)
For those sounds whose target word shows the highest agreement, the results confirm that they successfully convey the target concept. There are about ninety sounds in this category. These soundnails are effective and can likely be utilized to assist language comprehension and communication.
-
(2)
For the sounds of which the label with the highest agreement (different from the target word) matches the sound description (given in the sound file name), it can be said that the sound (scene) is distinctive and can convey a concept, though different from what is desired. About 150 sounds are in this category. Two possible reasons can be cited for this result. (a) The desired concept requires extra linkage to the sound scene; (b) the participants focused on different objects or aspects related to the sound.
-
(3)
The sounds where participants provided labels different from the sound description with high agreement are suggestive of a concept, though not the a priori one. About 52 sounds fall into this category.
-
(4)
In the case of the sounds for which participants in general did not agree (low top scores), we conclude that they lack the necessary characteristics for people to identify and associate them with specific concepts. About 35 fall into this category.
Of course, cases (2–4) may simply suggest problems with the scripting and sound selection. Further analysis on why people came up with different labels than what was desired can guide our future refinement of the construction of a network of concept-nonlinguistic audio connections.
One of our hypotheses, that different sounds that can be associated with the same concept may differ with respect to the effectiveness with which they evoke the concept, was verified. For a first test of this hypothesis, we assigned different sounds to most of the target words. For example, for "microwave," both the sounds that were prelabelled "loading dishes and close the door" and "spinning and ending" were given. Figure 8 shows the sense score distribution of the top ten sense sets for the two sounds assigned to "telephone." One can see that the "phone ringing" sound is more distinctive than the "lifting receiver and dialling" sound. The differences for the agreed-upon sense sets for the two sounds also suggested that different scenes, events, and actions could be evoked even with the same sound source.

Top 10 sense score distribution of two sounds for "telephone."Sound: telephone, ring pick upSound: telephone, lift handle dial
6.3. Audio Categorization
In order to draw some conclusion from our results concerning the audioability of our stimuli, the 327 sounds were categorized based three different criteria suggested by a linguist and a sound specialist. These categories reflect the three questions that motivated our experiment.
-
(1)
Source: source of the sound (Table 7).
-
(2)
Event: complexity in terms of the number of interacting participants (Table 8).
-
(3)
Scene: location where the sounds are likely to take place (Table 9).
Table 7 Descriptions of sounds divided by category. Table 8 Descriptions of sounds divided by event. Table 9 Descriptions of sounds divided by Scene.
From the top score histograms (the  -axis represents the number of sounds in each bin), we can see that, in general, synthesized sounds are quite ambiguous (Figure 9). People often associate them with science fiction and movies. By contrast, single source natural sounds are very distinctive (Figure 10). An example of an outlier is "Cold, Teeth Chatter." Figure 11 shows that participants could identify sound scenes involving humans relatively easily. For example, they can tell a restaurant from a train station and a school from an office. For most of the other categories, the distributions of the top sense score are quite spread out, and no solid conclusions can be drawn.

Top score histograms BellSynthetic sound category.

Top score histograms for SingleNature sound category.

Top score histograms for HumanScene sound category.
6.4. Audioability and Parts of Speech
Another way to evaluate the results is to ask whether how well the semantic human labels align with the a priori labels classified by parts of speech and the audioability rating. Table 10 compares the numbers of words from different parts of speech for the target words and the most agreed-upon label for all sounds. The table further lists the parts of speech distribution among words (broken down the sense sets) that at least 25% of the participants agreed to assign to a sound. Table 11 gives further details in differences between intended parts of speech and labelled parts of speech. Note that the total number does not add up to 327 because some words can be in different parts of speech though with similar meanings. For example, people used "rain" both as a noun and a verb in their labels. Difference in labels by part of speech here does not impact the audioability rating.
7. Discussion
7.1. Sources of Discrepancies in Audio Interpretation
There is a number of reasons why people may interpret the sounds differently from one another and from the a priori labels. Here, we are discussing cases (3) and (4) mentioned in Section 6.2.
Concepts that are ambiguous from an audio characteristics perspective do not seem to have a unique sound associated with them, or at least not a sound distinctive enough at a finer level. For example, a "desk" does not have a characteristic sound of itself, because artifacts do not generate sounds by themselves unless they are deployed by a user; similarly, it seems difficult to distinguish the sound of an iron bell from that of a steel bell, which suggests that fine-grained differences among category members are not audible.
The participants' familiarity with the sound could be an important factor affecting their perception. For example, many people mistook the lion roaring sound to a bear sound and even a cow call. Life experience is a related factor. Comparing the AMT labels to the pilot study labels, we found that the young students in the pilot study made many more mistakes in identifying an old-style phone dialling sound.
A conceptual-linguistic perspective suggests that many abstract concepts are difficult to evoke with sounds. For example, we tried to represent the concept "day" (meaning a complete 24-hour cycle) by combining a rooster crowing, a clock ticking, and crickets chirping into one sequence. While most participants were able to identify one or more concepts in the sequence, none of them generated the label "day." Similarly, the sound for "winter" was in most cases labelled "Christmas." It suggests that for very abstract concepts, people tend to associate the sound with more specific events.
We tried to represent abstract concepts like "up" and "down" by changing the pitch of the sounds, similar to earcons [22]. However, nearly all participants labelled these as synthetic sounds for games or alarms. Attempts to illustrate "left" and "right" failed in similar ways (we could not determine if users had proper stereo sound systems). This appears to support previous research that compared to actual environmental sounds, earcons need more learning [23].
7.2. Better Audio Categorization in Terms of Expressiveness
Our three criteria (sources, locations, and events) for accounting for sounds' audioability are not sufficient to explain the results. More relevant factors that impact the distinctiveness of nonspeech audio should be hypothesized investigated. For example, material (glass versus metal versus stone) might be a strong indicator [24].
A better categorization of sounds based on their expressiveness will provide guidance for designing improved nonspeech audio representations of concepts.
8. Summary and Conclusions
In this paper, we describe an experiment collecting a large number of human-generated semantic labels for a collection of nonspeech audio clips. The ultimate goal is to create effective auditory representations for commonly used concepts to assist language comprehension, acquisition, and communication. The audio clips are played to evoke intended concepts to rebuild/enhance the missing links between words and actual concepts for people with language disabilities or barriers in the context of Augmentative and Alternative Communication, language rehabilitation, and reading comprehension.
In the experiment, which was conducted online via the Amazon Mechanical Turk platform, 327 "soundnails" associated with 184 words from different parts of speech were labelled by over 100 participants each, addressing the source(s), location(s), and event(s) involved in the audio content. The soundnails had a maximal length of five seconds and were extracted from special sound effect collections using audio processing and machine learning schemes. Labels were normalized (stemmed) and regrouped into semantic units (sense set). A score based on word counts and the number of labellers was calculated per sense set per sound. Several evaluation metrics were proposed to further assess how well a sound can convey a concept.
Results showed that about a third of the soundnails evoked the a priori concepts. For another half of the sounds the auditory contents were correctly identified, though participants agreed on labels (sense sets) that differed from the target concepts. Those sounds were verified and they can be directly applied to our nonspeech audio enhanced semantic vocabulary network. The remaining sounds were either too similar to other auditory events, or too ambiguous to generate agreement among human labellers. Different possible reasons that affect the expressiveness and descriptiveness of a sound were discussed, from auditory complexity and characteristics, linguistic features to human-related factors.
Three categorizations of sounds, based on sources, locations, and events, respectively, were proposed in order to explore the factors bearing on the distinctiveness of sounds and their effectiveness in conveying specific concepts. However, only a few categories were strongly indicative of the expressiveness of the sounds. Future work will include analyses based on different criteria, such as the material make-up of objects involved in the sounds.
References
Ng S, Bradac J: Power in Language: Verbal Communication and Social Influence. Sage, Beverly Hills, Calif, USA; 1993.
Ma X, Cook P: How well do visual verbs work in daily communication for young and old adults? In Proceedings of the 27th International Conference on Human Factors in Computing Systems (CHI '09), 2009, Boston, Mass, USA. ACM Press, New York, NY, USA;
Danielsson H, Jonsson B: Pictures as language. Proceedings of the International Conference on Language and Visualization, 2001, Stockholm, Sweden
Saygin AP, Dick F, Wilson SW, Dronkers NF, Bates E: Neural resources for processing language and environmental sounds: evidence from aphasia. Brain 2003, 126(4):928-945. 10.1093/brain/awg082
Clarke S, Bellmann A, De Ribaupierre F, Assal G: Non-verbal auditory recognition in normal subjects and brain-damaged patients: evidence for parallel processing. Neuropsychologia 1996, 34(6):587-603. 10.1016/0028-3932(95)00142-5
Dick F, Bussiere J, Saygm A: The effects of linguistic mediation on the identification of environmental sounds. Center for Research in Language Newsletter 2002, 14(3):3-9.
Yost W, Popper A, Fay R: Auditory Perception of Sound Sources. Springer, London, UK; 2007.
Watanabe K, Shimojo S: When sound affects vision: effects of auditory grouping on visual motion perception. Psychological Science 2001, 12(2):109-116. 10.1111/1467-9280.00319
Schnider A, Benson DF, Alexander DN, Schnider-Klaus A: Non-verbal environmental sound recognition after unilateral hemispheric stroke. Brain 1994, 117(2):281-287. 10.1093/brain/117.2.281
Ellis D: Prediction-driven computational auditory scene analysis, Ph.D. thesis. Department of Electrical Engineering and Computer Science, Massachusetts Institute of Technology, Cambridge, Mass, USA; 1996.
Harb H, Chen L: A general audio classifier based on human perception motivated model. Multimedia Tools and Applications 2007, 34(3):375-395. 10.1007/s11042-007-0108-9
Freesound Project, 2008, http://www.freesound.org
Marcell MM, Borella D, Greene M, Kerr E, Rogers S: Confrontation naming of environmental sounds. Journal of Clinical and Experimental Neuropsychology 2000, 22(6):830-864. 10.1076/jcen.22.6.830.949
Lakatos S, Scavone G, Cook P: Obtaining perceptual spaces for large numbers of complex sounds: sensory, cognitive, and decisional constraints. In Proceedings of the 16th Annual Meeting of the International Psychophysics Society, 2000 Edited by: Bonnet C. 245-250.
Lingraphica, 2005, http://www.lingraphicare.com
BBC Sound Effects Library, 2007, http://www.sound-ideas.com/bbc.html
Fellbaum C: WordNet: Electronic Lexical Database, A Semantic Network of English Verbs. MIT Press, Cambridge, Mass, USA; 1998.
FindSounds, 2008, http://www.findsounds.com
Tzanetakis G, Cook P: Musical genre classification of audio signals. IEEE Transactions on Speech and Audio Processing 2002, 10(5):293-302. 10.1109/TSA.2002.800560
Amazon Mechanical Turk, 2007, https://www.mturk.com/mturk/welcome
Natural Language Toolkit (NLTK), 2007, http://www.nltk.org
Brewster SA, Wright P, Edwards A: An evaluation of earcons for use in auditory human-computer interfaces. In Proceedings of the Conference on Human Factors in Computing Systems (INTERCHI '93), 1993. ACM Press; 222-227.
Blattner M, Sumikawa D, Greenberg R: Earcons and icons: their structure and common design principles. Human-Computer Interaction 1989, 4(1):11-44. 10.1207/s15327051hci0401_1
Rocchesso D, Fontana F: The Sounding Object. Mondo Estremo; 2003.
Acknowledgments
The authors would like to thank the Princeton Sound Lab and the Human Computer Interaction Group for assistance with the experimental design. They are grateful to the Kimberly and Frank H. Moss '71 Research Innovation Fund of the Princeton School of Engineering and Applied Science, and the Microsoft Intelligent Systems for Assistive Cognition Grants for their support.
Author information
Authors and Affiliations
Corresponding author
Rights and permissions
Open Access This article is distributed under the terms of the Creative Commons Attribution 2.0 International License (https://creativecommons.org/licenses/by/2.0), which permits unrestricted use, distribution, and reproduction in any medium, provided the original work is properly cited.
About this article
Cite this article
Ma, X., Fellbaum, C. & Cook, P. Semantic Labeling of Nonspeech Audio Clips. J AUDIO SPEECH MUSIC PROC. 2010, 404860 (2010). https://doi.org/10.1155/2010/404860
Received:
Accepted:
Published:
DOI: https://doi.org/10.1155/2010/404860